🎁 💸 Warren Buffett's Top Picks Are Up +49.1%. Copy Them to Your Watchlist – For FreeCopy Portfolio

Buy Signals Blown Away; Volatility Bounce Looks To Be In Play

Published 10/11/2018, 12:20 AM
Updated 07/09/2023, 06:31 AM
NDX
-
US500
-
DJI
-
US2000
-
SOX
-
VXN
-

Yesterday, the support levels which were on offer for the Russell 2000, Dow Jones Industrial Average and S&P were undone by the biggest 1-day loss in the year. Not surprisingly, volume rose in distribution as traders bailed. The only index to finish on support was the NASDAQ 100. Although with a 4%+ loss it would be a brave trader to be buying the 200-day MA.
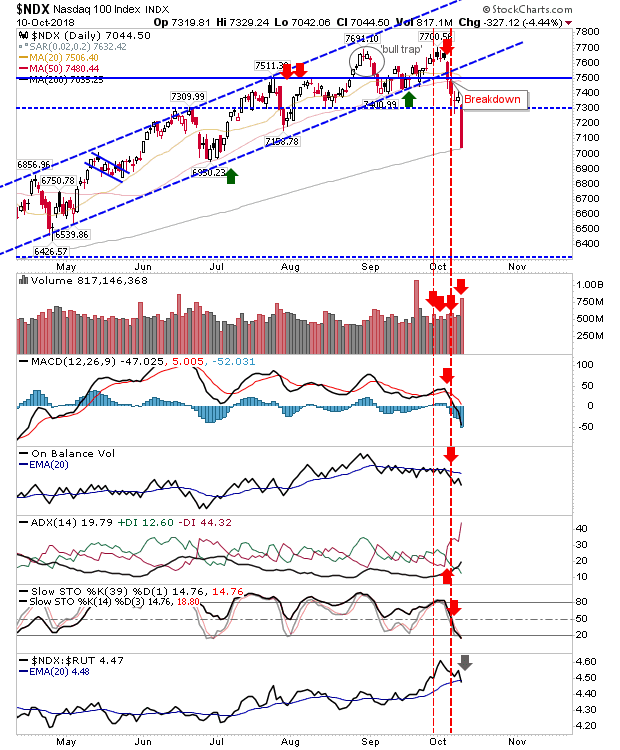
NDX Daily Chart


The S&P is heading towards its 200-day MA and closed yesterday just a shade below minor horizontal support. A relief bounce is likely but it's questionable how long it will last. Technicals turned net bearish so a new intermediate length (3 weeks to 3 month) down phase has begun.

SPX Daily Chart


The NASDAQ didn't stall at its 200-day MA, which is not good news for other indices. Technicals are all net bearish as relative performance accelerated lower.
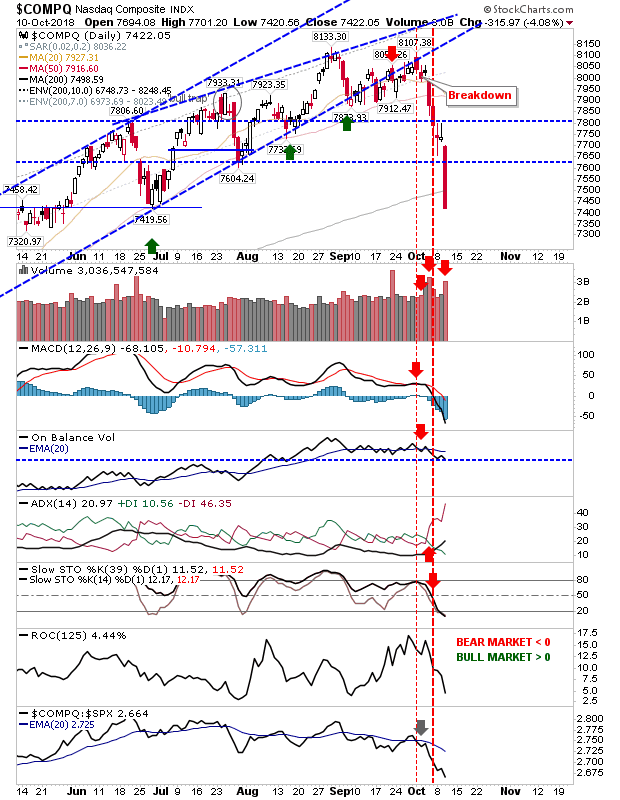
COMPQ Daily Chart


Semiconductorscontinued their rout. The CCI is deeply oversold as relative performance builds a slow reversal with price testing April/May swing lows. Shorts should be looking to take profits and even aggressive buyers could fish around yesterday's close.
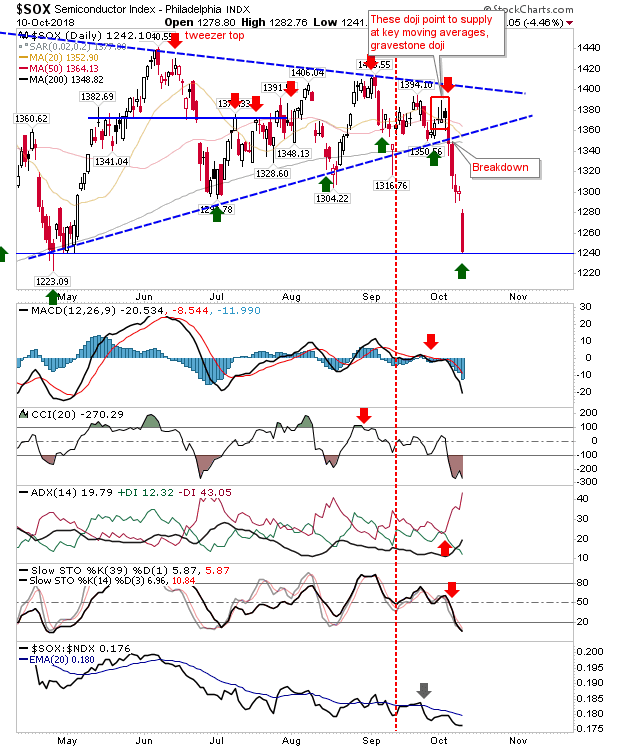
SOX Daily Chart


After hugging channel support, the Dow Jones Industrial Average finally cut loose yesterday and burned through channel support. It failed to stop at its 50-day MA and is now looking at its 200-day MA. There was no other technical change although the big red candlestick was damaging enough.
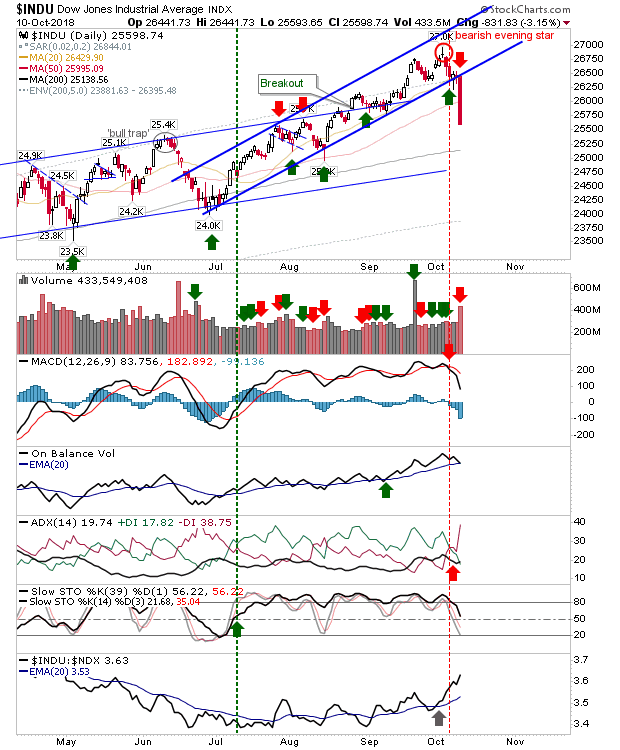
INDU Daily Chart


The Russell 2000 wasn't able to defend its 200-day MA and sold off with an undercut of the stop of the 200-day MA buy signal. Ironically, this came with a bullish cross in relative performance—this index is the strongest of the weakest!
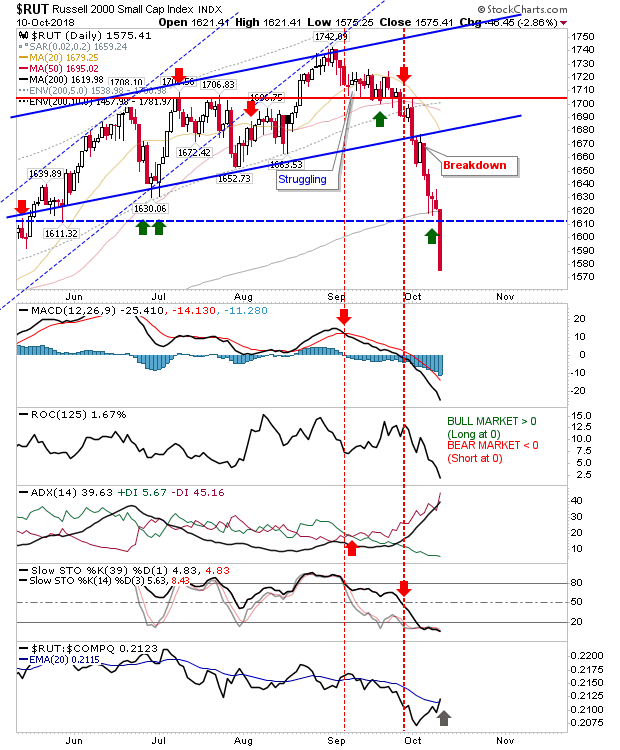
RUT Daily Chart


There's a good chance for a relief bounce today, but buying for the long-term would still be a little early. The volatility bounce looks to be in play too; a time to end the multi-year period of calm?
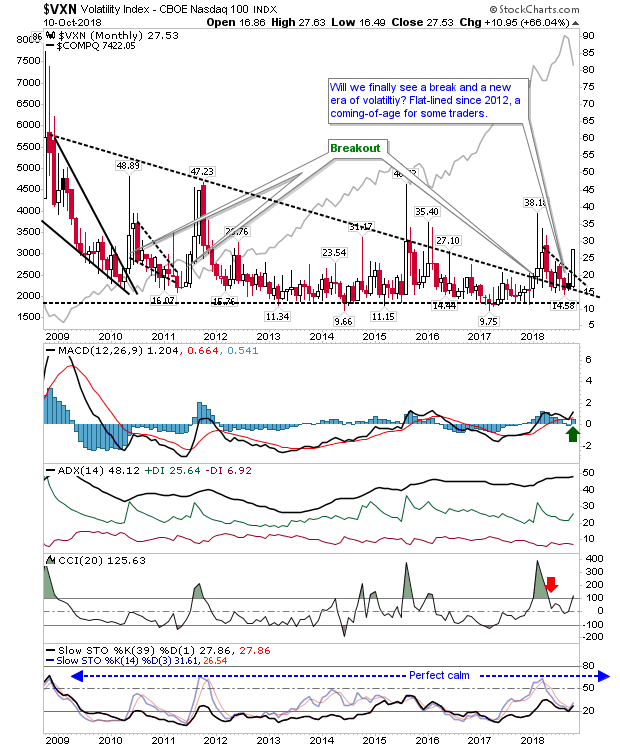
VXN Monthly Chart

Latest comments

Loading next article…
Risk Disclosure: Trading in financial instruments and/or cryptocurrencies involves high risks including the risk of losing some, or all, of your investment amount, and may not be suitable for all investors. Prices of cryptocurrencies are extremely volatile and may be affected by external factors such as financial, regulatory or political events. Trading on margin increases the financial risks.
Before deciding to trade in financial instrument or cryptocurrencies you should be fully informed of the risks and costs associated with trading the financial markets, carefully consider your investment objectives, level of experience, and risk appetite, and seek professional advice where needed.
Fusion Media would like to remind you that the data contained in this website is not necessarily real-time nor accurate. The data and prices on the website are not necessarily provided by any market or exchange, but may be provided by market makers, and so prices may not be accurate and may differ from the actual price at any given market, meaning prices are indicative and not appropriate for trading purposes. Fusion Media and any provider of the data contained in this website will not accept liability for any loss or damage as a result of your trading, or your reliance on the information contained within this website.
It is prohibited to use, store, reproduce, display, modify, transmit or distribute the data contained in this website without the explicit prior written permission of Fusion Media and/or the data provider. All intellectual property rights are reserved by the providers and/or the exchange providing the data contained in this website.
Fusion Media may be compensated by the advertisers that appear on the website, based on your interaction with the advertisements or advertisers.
© 2007-2024 - Fusion Media Limited. All Rights Reserved.