Company: Ulta Beauty (NASDAQ:ULTA)
Country: USA
Sector: Services
Industry: Retail (Specialty)
Suitability: long term investing; buy and hold
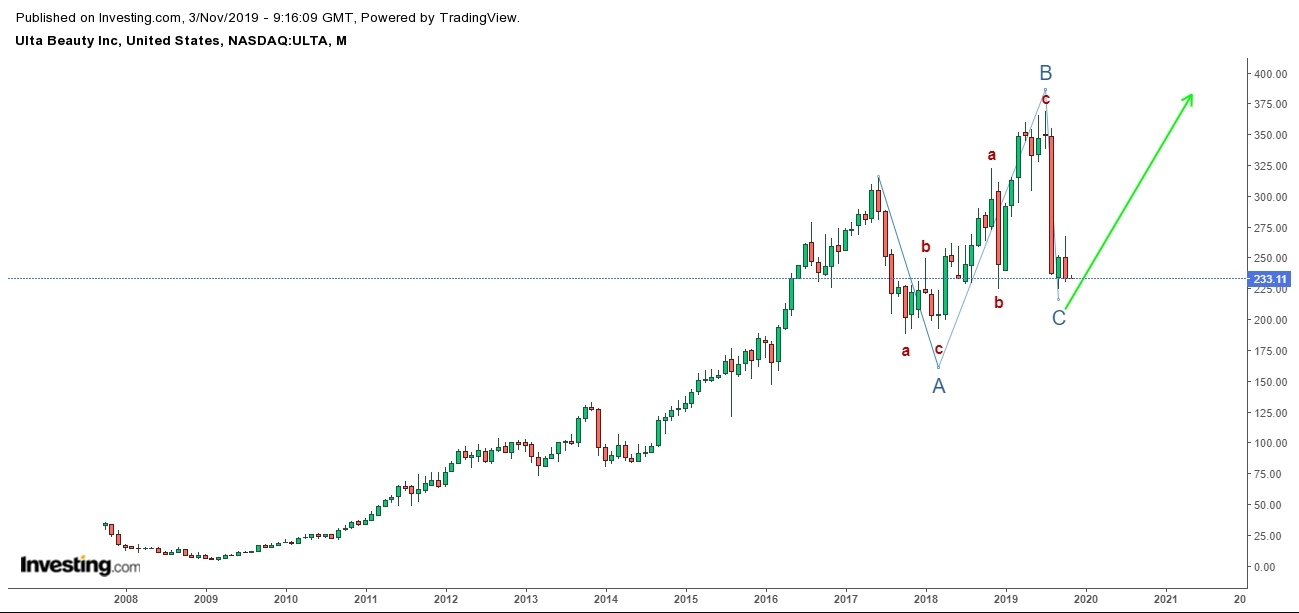
Share Price: $ 233.11 (week end 1.11.2019)
[S&P 500: $ 3066.91 (week end 1.11.2019)]

Fundamental Analysis
Summary:
*Performance: 7/10
*Security: 8/10
*Price: 5/10
(Note: If the performance and security ranking is higher than price ranking the company is supposed to be undervalued and possibly suitable for buying.)
The price of the security overreacted to the earnings report in our view.
The day before the earnings report (28.8.2019), the price closed at 330.38 and the day after the earnings report (30.8.2019), the price closed at 237.73, a 28.0% plunge in price in just 2 days.
The price has more or less remained in the territory of the drop.
The reported earnings per share and revenue came in weaker, but not enough to indicate “bad health” or to invalidate the growing trend of the company in the long run.
The company has had consistent and relatively stable growth in sales since 2011 ca. 20% annually.
It has maintained reasonable operational profit margins, which stabilized around 13% since 2014 and a strong return on investment, which grew over the last decade and stabilized around 23% in the past 5 years.
The earnings per share were growing 38% annually on average since 2011 (ca. 31% avg. since 2013 when the overall growth trend more or less stabilized and it has remained till now although annual values fluctuate (16 – 39% annually).The more recent earnings per share were also impacted by the lower effective tax rate since 2018 (was ca. 37% now ca. 24%) and contracting weighted average of shares as the company has been buying them back since 2015 (ca 2% ann. in avg.) although the number of shares was growing prior.
The P/E ratio is just bellow 20 (19.73) which means that the “company interest rate” (12 months earnings/share price) is slightly above 5% annually which is not bad in regards to low-interest rates on government bonds nowadays
The company hasn’t got any long term debts, hidden debts or preferred shares act. therefore there is no risk from financial gearing and we haven’t identified increased risk coming from excessive operational gearing (too much-fixed cost) either. Revenue fluctuates within a reasonable limit and it is unlikely this will change in foreseeable future. There is no concern regarding cash flow.
The company doesn't pay dividends but it rather significantly reinvests its money either in CAPEX (funds for acquiring, maintaining and upgrading of physical assets) and, as we have already mentioned, in stock repurchases. The CAPEX was around double the depreciation on average with little fluctuation over the last decade, which is significant level, apart from the period of the last 18 months when the CAPEX was 1.1 x depreciation. Nevertheless, the company increased stock repurchases around 60% (stock repurchase was ca 2.1 of depreciation in the last 18 months) so it could be said that the company more or less borrowed money from its usual CAPEX to finance increased stock repurchase.
The price of the company stock dropped rather significantly (ca 28%) soon after the last repurchase nevertheless even this more significant drop didn’t invalidate the overall growing trend of the share price.
Technical Analysis
Summary:
*Time to Buy: 8/10
The price of the security appears to be around the bottom of a correction pattern, which is a good spot to buy, although the technical indicators have not indicated the development of bullish trend (trend of rising price) yet.

*Performance
The better the performance, the higher the ranking.
Performance ranking includes both current performance and potential of the company to grow.
*Security
The more secure the company, the higher the ranking.
Security ranking answers how likely the company is to experience problems and how well it is supposed to deal with them.
*Price
The higher the price the higher the ranking.
Price ranking doesn’t take into account the performance or security of the company.
Note: If the performance and security ranking is higher than price ranking the company is supposed to be undervalued and possibly suitable for buying.
*Time to Buy
The better the time to buy, the higher the ranking.
