Back in 1995, Caltech’s Dr. David J. Leinweber published a research paper showing three simple variables that were highly correlated (r=.99) with the return on the S&P 500 stock market index over the last 10 years. Surely, if stock market returns could be forecasted with such accuracy, anyone who read the paper (which is freely available here) would quickly become billionaires with their own private islands!
What were the three variables, you ask?
They were butter production in Bangladesh, cheese production in the US, and the combined sheep population of Bangladesh and the US.
What?!
By now, I would hope you realize something is amiss. To explain this bizarre finding, I’ll defer to the words of Leinweber himself: “The example in this paper is intended as a blatant example of totally bogus application of data mining in finance…If someone showed up in your office with a model relating stock prices to interest rates, GDP, trade, housing starts and the like, it might have statistics that looked as good as this nonsense, and it might make as much sense, even though it sounded much more plausible.”
The author’s point, and a critical lesson for all traders to keep in mind, is that all trading models have limitations and that spurious correlations abound in financial markets. All correlation data should be used with caution, and traders using such statistics must verify that there is an actual “transmission mechanism” between the two variables; in other words, does it actually make sense that butter production in Bangladesh impacts US stock market prices? Probably not. In the case of the recent strong correlation between USD/JPY and the S&P 500 though, the causal relationship is much more logical and actionable.
USD/JPY and S&P 500 Go Together like Peas and Carrots
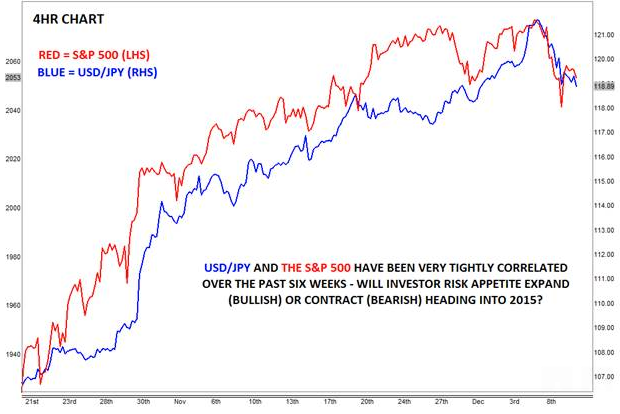
As of writing, the rolling 20-day correlation between USD/JPY and the S&P 500 is .80, while the rolling 50-day correlation is even higher at .94. As the 4hr chart below shows, this correlation has been particularly tight of late:

Source: FOREX.com
Note: There is no guarantee that this strong correlation will persist in the future, and factors beyond investors’ risk appetite may impact both instruments in the future.
Unlike butter production in Bangladesh, however, the transmission mechanism between these two trading instruments is clear: investor risk appetite. When traders are feeling more optimistic about the global economy (and the US in particular), as we’ve seen of late, they tend to buy both the dollar and US stocks. Conversely, when serious global risks emerge, traders tend to sell equities and buy the “safe haven” Japanese yen.
The upshot of this strong correlation is clear for equity and FX traders: if you believe the current China- and Greece-induced pullback in USD/JPY and US stocks will quickly blow over, the recent dip may represent a good time to buy into the established uptrends while USD/JPY and the S&P 500 are “on sale.” On the other hand, if you feel the recent stumble is the proverbial “canary in the coal mine” for a more meaningful pullback in US equities, then it would make sense to tone down on USD/JPY bullishness as well.
Given the economic and monetary policy tailwinds for both instruments, I’m inclined to give the USD/JPY and the S&P 500 rallies the benefit of the doubt for now, but in the immortal words of economist John Maynard Keynes, “If the facts change, I[‘ll] change my mind.”
For more intraday analysis and market updates, follow us on twitter (@MWellerFX and @FOREXcom).
