Get 40% Off
These stocks are up over 10% post earnings. Did you spot the buying opportunity? Our AI did.Read how

Bullish Island Reversal Pattern On The SPY

Published 12/16/2015, 12:57 AM
Updated 07/09/2023, 06:31 AM

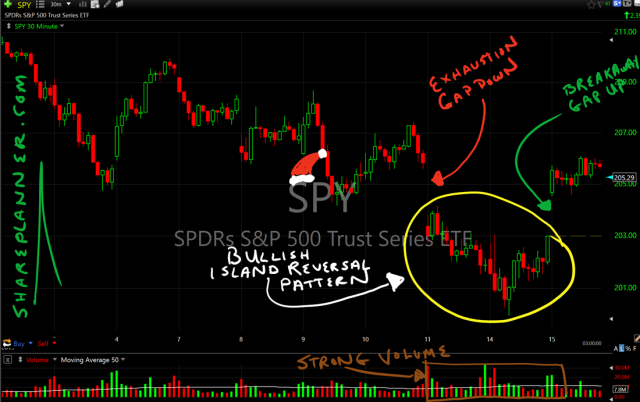
I'm using the 30 minute chart because it is the easiest to see, but this Bullish Island reversal pattern is valid from the daily chart all the way down to the 1 minute chart.

This is a bullish pattern that doesn't develop often, but when it does, often markets the bottom to a recent sell-off, or the top of a recent rally. With the FOMC tomorrow, that can obviously change things, but I doubt the Fed wants to do much to add fuel to the fire that has already been created from the realization that they'll will be in fact raising rates this time. As a result, I wouldn't be surprised to see them raise rates, and in their statement try and add some "feel-good" words to juice the market.

But yes, the pattern below is very legit, and even though it seems like today is a rally fueled by commodities and biotech, there is plenty of room for tech to join in on the rally, should it decide to keep it going.

SPDR S&P 500 (N:SPY) 30 Min Chart
SPY 30 Min Chart

Original post

Latest comments

Risk Disclosure: Trading in financial instruments and/or cryptocurrencies involves high risks including the risk of losing some, or all, of your investment amount, and may not be suitable for all investors. Prices of cryptocurrencies are extremely volatile and may be affected by external factors such as financial, regulatory or political events. Trading on margin increases the financial risks.
Before deciding to trade in financial instrument or cryptocurrencies you should be fully informed of the risks and costs associated with trading the financial markets, carefully consider your investment objectives, level of experience, and risk appetite, and seek professional advice where needed.
Fusion Media would like to remind you that the data contained in this website is not necessarily real-time nor accurate. The data and prices on the website are not necessarily provided by any market or exchange, but may be provided by market makers, and so prices may not be accurate and may differ from the actual price at any given market, meaning prices are indicative and not appropriate for trading purposes. Fusion Media and any provider of the data contained in this website will not accept liability for any loss or damage as a result of your trading, or your reliance on the information contained within this website.
It is prohibited to use, store, reproduce, display, modify, transmit or distribute the data contained in this website without the explicit prior written permission of Fusion Media and/or the data provider. All intellectual property rights are reserved by the providers and/or the exchange providing the data contained in this website.
Fusion Media may be compensated by the advertisers that appear on the website, based on your interaction with the advertisements or advertisers.
© 2007-2024 - Fusion Media Limited. All Rights Reserved.