
Broadridge Financial Solutions, Inc. (NYSE:BR) reported disappointing second-quarter fiscal 2019 results, with earnings and revenues lagging the Zacks Consensus Estimate.
Adjusted earnings of 56 cents per share missed the consensus mark by 15 cents and declined 29% on a year-over-year basis. Total revenues of $953 million lagged the consensus mark by $17 million and fell 6% year over year.
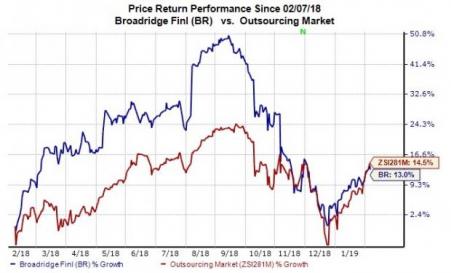
So far this year, shares of Broadridge have gained 13% compared with the 14.5% rise of the industry.
Let’s check out the numbers in detail.
Revenues by Segment
Revenues in the Investor Communication Solutions segment fell 8% from the year-ago quarter’s level to $738 million. The decrease was due to fall in event-driven and distribution revenues, partially offset by increase in recurring fee revenues.
Global Technology and Operations segment revenues came in at $237 million, up 4% from the year-ago quarter’s tally. The figure was driven by internal growth from higher trade levels and net new business from closed sales.
Revenues by Type
Recurring fee revenues of $604 million rose 7% from the year-ago quarter’s level and were driven by organic growth, recent acquisitions and impact of revenue accounting change. Event-driven fee revenues of $48 million plunged 51% year over year, mainly due to lower mutual fund proxy revenues and equity proxy contests.
Distribution revenues were down 13% year over year to $323 million. Changes in foreign currency rates negatively impacted revenues by $4 million compared with the prior-year quarter’s period.
Broadridge Financial Solutions, Inc. Revenue (TTM)

Operating Results
Adjusted operating income of $101 million fell 27% year over year. Adjusted operating income margin decreased to 10.6% from 13.7% in the prior-year quarter. Decline in event-driven fee revenues, higher selling expenses and increased spending on technology initiatives led to margin contraction.
Balance Sheet and Cash Flow
Broadridge exited second-quarter fiscal 2019 with cash and cash equivalents of $249.8 million compared with $204.7 million at the end of prior quarter. Long-term debt was $1.19 billion compared with $1.14 billion at the end of the prior quarter.
The company generated $177.6 million of cash from operating activities and spent $12.3 million on capex in the quarter. Non-GAAP free cash flow was $162.8 million. Broadridge paid $56.5 million in dividends in the reported quarter.
Fiscal Third Quarter Guidance
Management expects total revenues in the range of $1,195-$1,245 million, higher than the Zacks Consensus Estimate of $1,280 million. Recurring fee revenue growth is anticipated between $755 million and $780 million. Adjusted EPS are expected in the range of $1.40-$1.56 per share. The Zacks Consensus Estimate is pegged at $1.56.
Fiscal 2019 Guidance
Broadridge reaffirmed guidance for fiscal 2019. Total revenues are expected to grow in the range of 3-5%. Recurring fee revenue growth is anticipated in the 5-7% range. Adjusted EPS are expected to register 9-13% growth.
Adjusted operating income margin is estimated to register approximately 16.5% growth. Non-GAAP free cash flow is projected in the range of $565-$615 million.
Zacks Rank & Stocks to Consider
Broadridge currently carries a Zacks Rank #4 (Sell).
Investors interested in the broader Zacks Business Services sector are keenly awaiting fourth-quarter 2018 earnings reports of key players like IQVIA Holdings (NYSE:IQV) , Waste Management (NYSE:WM) and TransUnion (NYSE:TRU) . These companies are scheduled to release results on Feb 14, before market opens. You can see the complete list of today’s Zacks #1 Rank (Strong Buy) stocks here.
Zacks' Top 10 Stocks for 2019
In addition to the stocks discussed above, wouldn't you like to know about our 10 finest buy-and-holds for the year?
From more than 4,000 companies covered by the Zacks Rank, these 10 were picked by a process that consistently beats the market. Even during 2018 while the market dropped -5.2%, our Top 10s were up well into double-digits. And during bullish 2012 – 2017, they soared far above the market's +126.3%, reaching +181.9%.
This year, the portfolio features a player that thrives on volatility, an AI comer, and a dynamic tech company that helps doctors deliver better patient outcomes at lower costs.
TransUnion (TRU): Free Stock Analysis Report
Broadridge Financial Solutions, Inc. (BR): Free Stock Analysis Report
Waste Management, Inc. (WM): Get Free Report
IQVIA Holdings Inc. (IQV): Free Stock Analysis Report
Original post
Zacks Investment Research