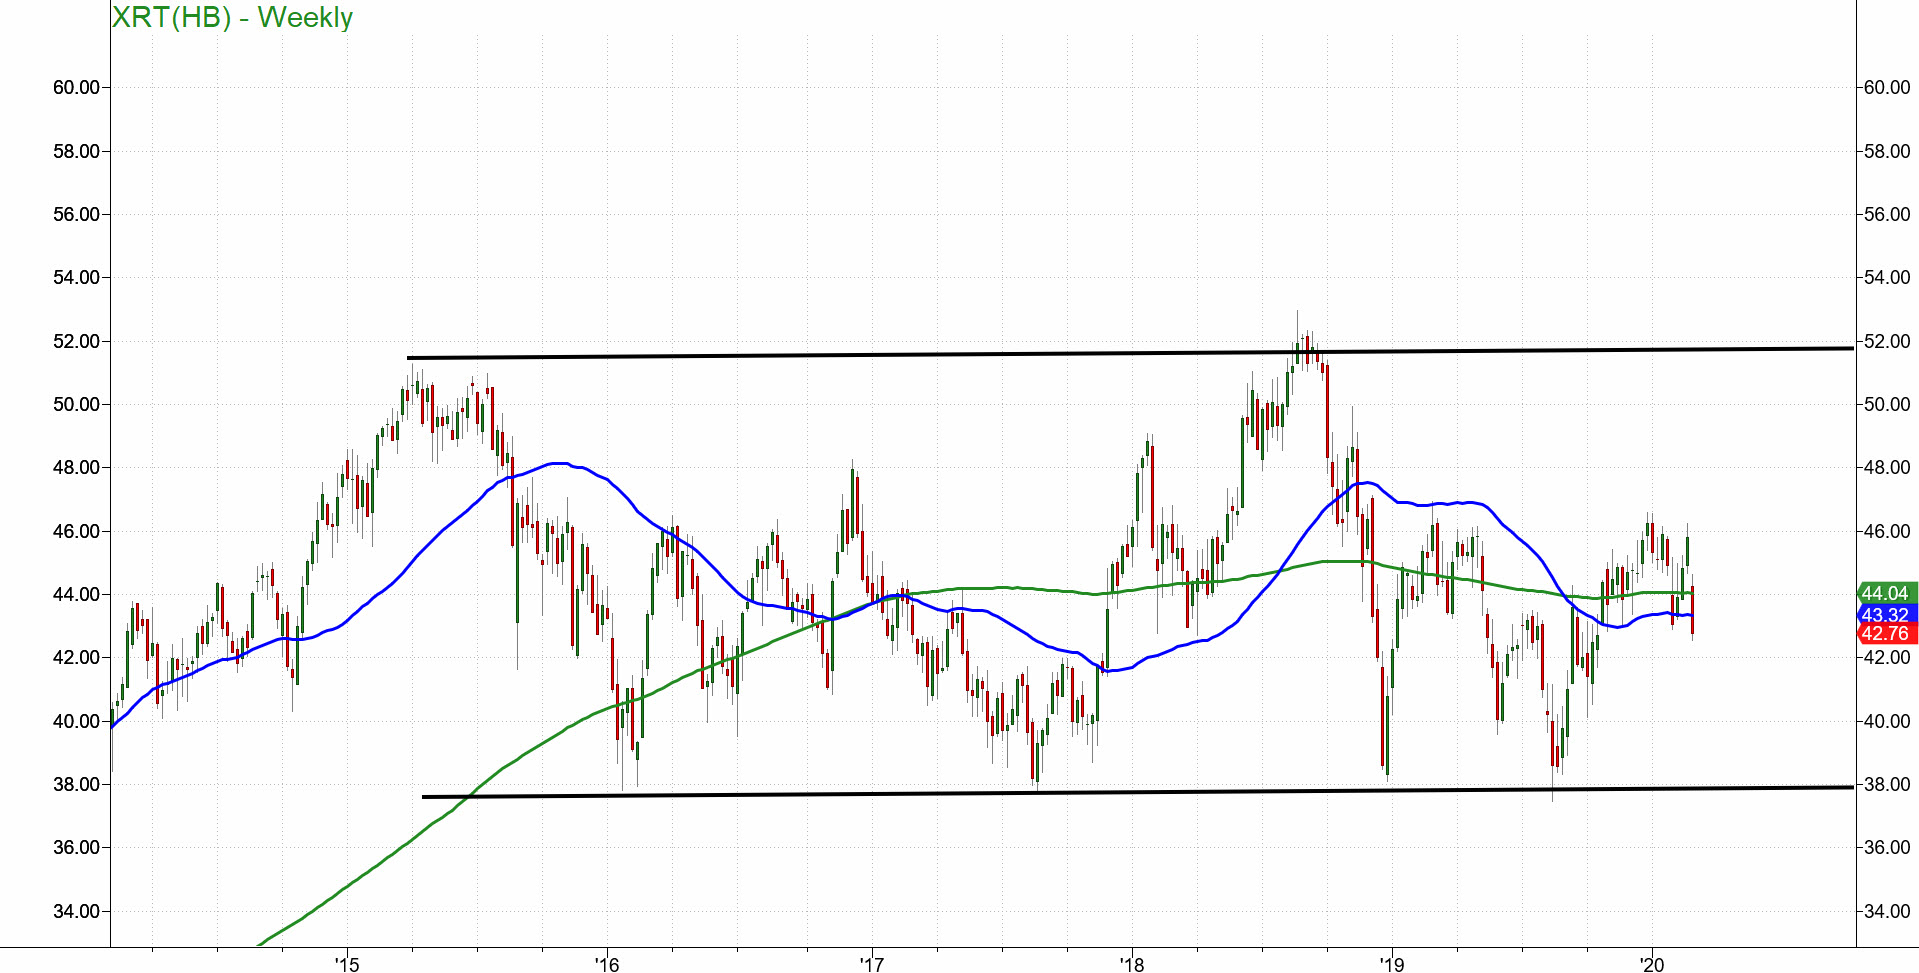
As you will see when you check out the chart of Granny Retail, she has had a virus since 2015.
Only once in 2018, did she look cured.
Since then, while the S&P 500, Nasdaq 100 and the Dow went to make new all-time highs earlier this year, XRT could not even clear the 2019 highs.
Now, there is a good argument that brick and mortar retail has gone the way of the dinosaur.
Over the last several years, JC Penney (NYSE:JCP), Macy’s (NYSE:M), Toys R Us, Mattel (NASDAQ:MAT), Pier One, to name a few, have either closed shop completely or diminished significantly in size.
Malls often resemble ghost towns these days.
Online shopping has helped retail sales look way better than what we see in brick and mortar.
However, the metrics for measuring the gross domestic product weighs heavily on how brick and mortar does.
Since the peak in 2018, XRT began trading on a one-way street going south.

On the weekly charts of the ETF Granny Retail XRT, one could make a case for a multi-year double top.
What you see on the chart is a very large, multi-year channel.
I love channels, especially ones as clear and historic as this one.
What I love most about them is how many times you can buy the bottom and sell the top.
In this channel, one might have gotten long in 2018 above the channel breakout. But, the smart traders saw that the channel failure was an even better opportunity to go short near the top.
Right now, the price is in the middle of the channel.
I bring this up today, a day when I saw so many “sages” on twitter tell people to buy the dip.
I became uncharacteristically vocal at how dangerous and irresponsible that is.
So keep your eyes on Granny as one indicator. IF XRT continues down its one way street south, then a channel break at the bottom will look as disheveled as our Granny in the photo.
S&P 500 (SPY): Confirmed warning phase-320.74 now key resistance with 307.75 support
Russell 2000 (IWM) Unconfirmed Distribution phase-remember what that means? A distribution of equities into cash-156.67 super pivotal
Dow (DIA) Unconfirmed distribution phase 272.43 pivotal
Nasdaq (QQQ) Unconfirmed caution phase with now 220.77 pivotal resistance
KRE (Regional Banks) UGLY-remember this?
SMH (Semiconductors) 136.96 the 4-week low now pivotal resistance 128 support
IYT (Transportation) 177.40 the 200—WMA.
IBB (Biotechnology) 117.35 key pivotal area-if clears then could buy with stop under 116.48 looking for 120 area
XRT (Retail) 43.00 pivotal resistance
Volatility Index (VXX) You know how many folks snarled when I wrote about the inverted doji hammers as warning to the bulls?
Junk Bonds (JNK) Broke down so if can get back over 108.50 and hold, perhaps the worst is over for the time being.
