Mainstream media commentators regularly tell you that higher interest rates in 2018 will not threaten your portfolio. After all, they assure you, tax reform added piles of dollars to the bottom line profits of corporations as well as placed mounds of money back into the pockets of millions of households.
Can one be certain, however, that fiscal stimulus (e.g., new spending package, recent tax overhaul, etc.) will neutralize increased borrowing costs? For example, a large chunk of prospective homeowners have already dropped out of the hunt to purchase a residence.
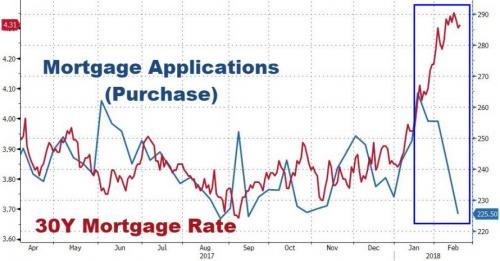
In the last week alone, as mortgage rates pushed upward toward four-year highs, purchase applications sank 6%. Over the last few weeks, applications for mortgages tumbled 15%.
Keep in mind, this is with the 30-year fixed rate mortgage hitting 4.64% (0.6 in fees). What happens if we revisit a 5% 30-year fixed? Or 5.5%? More prospective homeowners would find themselves stretched beyond the limits of affordability, putting a damper on the demand for new and existing properties. Home prices would struggle to appreciate in value and might even begin falling in value.
At the same time, refinancing for existing homeowners would falter. That too would strain the credit growth that sits at the heart of U.S.-based economic consumption. In aggregate, if household net worth stagnates or dips, and the ability or desire to tap home equity disintegrates, equanimity about consumption would follow suit.
Granted, household and business borrowing costs might not move significantly higher from here. Stabilizing interest rates remain a possibility, even though the federal government is auctioning off more Treasury bonds and foreign country demand for our sovereign debt is waning.
Perhaps the biggest threat to stabilizing borrowing costs? The Federal Reserve is in the process of reducing its balance sheet through the process of quantitative tightening (QT). It is difficult to imagine a scenario where domestic and foreign demand picks up the entire slack on Treasury bond supply — a supply where the Fed is no longer a participant on the demand side.
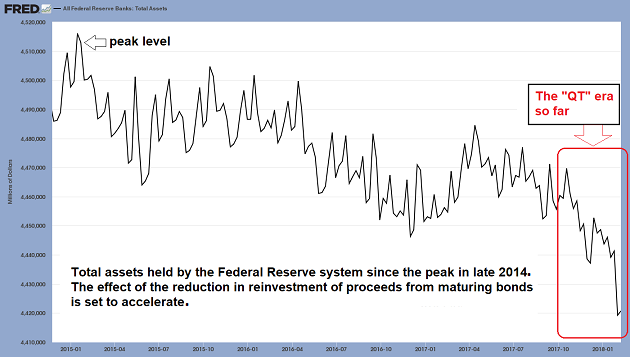
Corporations may also be forced to slow the rate of their own debt issuance. That would place a greater emphasis on their recent tax cut windfall.
Therein lies a significant question: What will corporations do with the tax cut dollars? If they continue to focus on short-term results as opposed to longer-term growth, they might further manipulate earnings per share (EPS) perceptions through stock buybacks. Reducing the share count, or supply, could keep prices elevated, even in the case of stable or modestly falling demand.
On the flip side, even with dollars going into stock buybacks from a one-time corporate tax boost, this may not be enough to sustain profit margins or year-over-year profit gains. The U.S. dollar has been weakening. Commodity price inputs have been rising. And increasing labor costs could occur in an environment that many believe to be “full employment.”
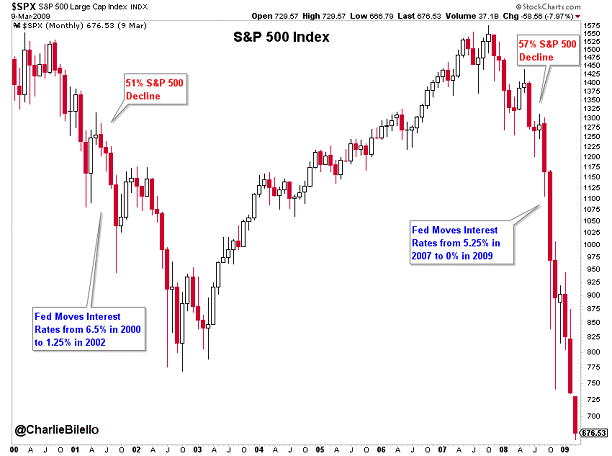
It follows that investors may be lulled into a false sense of security. They’ve come to believe that the Fed (and other central banks) can pass the Olympic torch from monetary stimulus to fiscal stimulus without incident. History, on the other hand, suggests that monetary policy error is a distinct possibility.
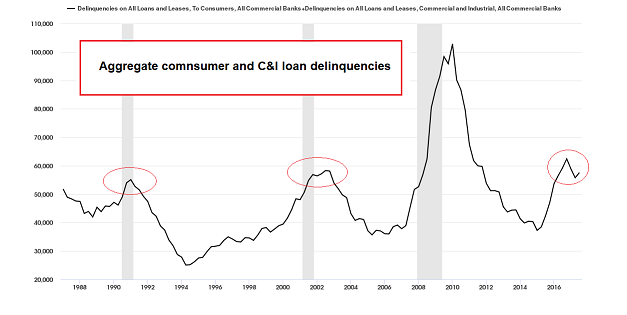
While history will not repeat itself in precisely the same manner, its knack for rhyming is uncanny. In that vein, we might consider the pattern for loan delinquencies. In the early 1990s and in the early 2000s, much like today, the Fed tightened rate policy at the same time delinquencies were on the ascent.
By all media accounts, the economy is on solid footing. (I am not sure why rates have been kept so low for an entire decade, nor is it clear why a massive spending bill and tax cut package became necessary for a “strong economy.” Yet I digress.) That said, gross domestic product (GDP) by itself does not significantly correlate with future stock market returns. In other words, even if investors get the acceleration in economic growth they’ve been anticipating, they may not see any reward in their portfolios, especially when borrowing costs move skyward.
It is true that we’ve seen borrowing costs rocket into the clouds before. We witnessed the infamous Fed taper tantrum back in 2013. If stocks performed admirably in that earlier environment, why couldn’t they do so in 2018?
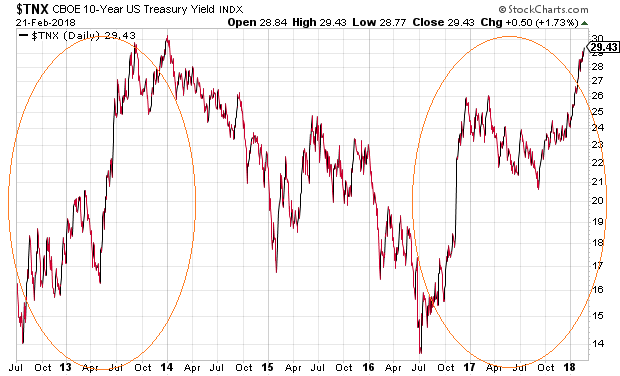
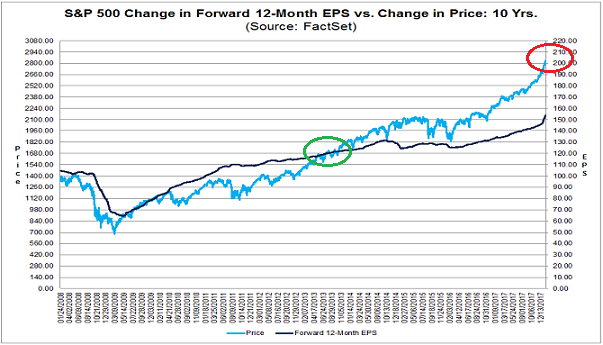
Stocks could perform wonderfully in 2018 like they did in 2013, in spite of borrowing cost woes. Still, there are significant differences. For one thing, stocks carried relatively attractive valuations five years ago compared with the present day.
Another issue? Due to the extraordinary quantitative easing (QE) measures by the world’s central banks (e.g., European Central Bank, Bank of England, Bank of Japan, Bank of England, Swiss National Bank, etc.), as well as the Federal Reserve’s maintenance of existing QE levels, borrowing costs effectively moved lower from a 2013 peak through the bulk of 2017. Now that global central banks are either slowing down their QE, or out-n-out tightening like the Federal Reserve, there is a recognition that borrowing costs are unlikely to move meaningfully lower until the next recession.
In last week’s commentary, I explained that the S&P 500 was in the process of reclaiming approximately half of its losses. I also explained that relief rallies in many 10%-plus pullbacks often go on to re-test their correction lows.
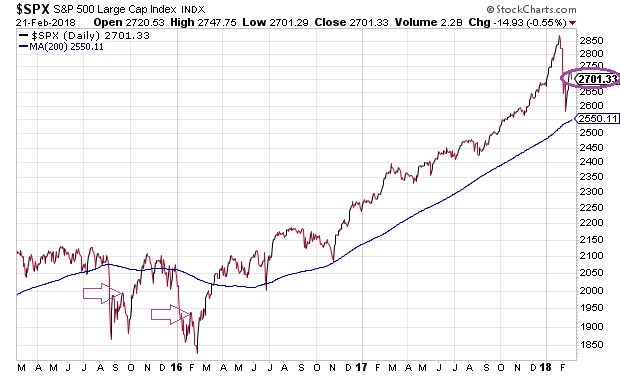
While there is no way to be certain that the current corrective phase will emulate earlier patterns, investors can presume that a pullback to the 200-day moving average at 2550 is a reasonable expectation for the S&P 500. Should borrowing costs continue to climb, and should the technical 200-day support fail to bolster stock buying demand, one might anticipate a deeper wound to the 9-year stock bull.
Disclosure: ETF Expert is a web log (“blog”) that makes the world of ETFs easier to understand. Gary Gordon, MS, CFP is the president of Pacific Park Financial, Inc., a Registered Investment Adviser with the SEC. Gary Gordon, Pacific Park Financial, Inc., and/or its clients may hold positions in the ETFs, mutual funds, and/or any investment asset mentioned above. The commentary does not constitute individualized investment advice. The opinions offered herein are not personalized recommendations to buy, sell or hold securities. At times, issuers of exchange-traded products compensate Pacific Park Financial, Inc. or its subsidiaries for advertising at the ETF Expert website. ETF Expert content is created independently of any advertising relationship.
