This is an update to a prior article dated February 13, 2012, in which I noted that a significant portion of Buckeye Partners’ (BPL) current yield (then 6.74%) did not seem to be generated from sustainable sources. BPL has since filed its 10-K and it is therefore possible to compare reported to sustainable cash flows for 2011.
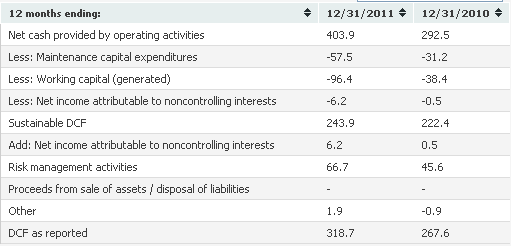
The definition of DCF used by BPL is described in an article titled Distributable Cash Flow (“DCF”). That article also provides, for comparison purposes, definitions used by other master limited partnerships. Using BPL’s definition, DCF for the 12 month period ending 12/31/11 was $318.7 million, up from $267.6 million in 2010 (per unit comparisons are not meaningful due to the November 19, 2010, merger between the partnership, BGH (the general partner),and the general partner of BGH.
The generic reasons why DCF as reported by the MLP may differ from sustainable DCF are reviewed in an article titled Estimating Sustainable DCF-Why and How. Applying the method described there to BPL results through December 31, 2011 generates the comparison outlined in the table below:
Figures in $ Millions
Risk management activities present the major difference between reported and sustainable cash flow. I generally I do not generally consider cash generated by risk management activities to be sustainable, although I recognize that one could reasonable argue that bona fide hedging of commodity price risks should be included. With respect to 2011, the bulk of this item appears to relate to interest rate hedges, and therefore I exclude it. Coverage ratios are provided in the table below:
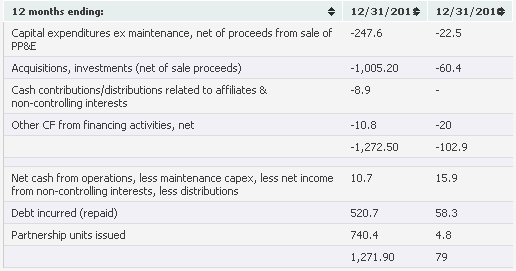
BPL’s coverage ratios are thin. Other master limited partnerships I have covered offer investors both better coverage ratios and higher yields. Of course, yields and coverage ratios are but two of many parameters to be looked at when selecting MLPs and, indeed, there are other factors cause me to remain cautious regarding BPL. Before touching on those, it will be helpful to look at a simplified cash flow statement by netting certain items (e.g., acquisitions against dispositions) and by separating cash generation from cash consumption.
Here is what I see for BPL:
Simplified Sources and Uses of Funds
Figures in $ Millions
In both 2011 and 2010, net cash from operations, less maintenance capital expenditures, less net income from non-controlling interests covered distributions, but just barely. In 2011 BPL spent $247.8 million on expansion capital expenditures (including cost reduction projects). This was financed by issuance of debt and equity. In 2012 BPL projects spending a similar amount (approximately $230 million) on expansion and cost reduction projects. Unless results from operations improve fairly quickly, BPL may have to issue additional partnership units to finance cap ex as the partnership is fairly highly levered (long term debt is 6.9x EBITDA and 4.9x Adjusted EBITDA).
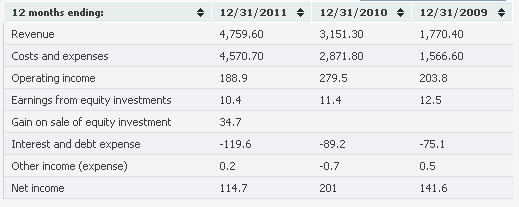
An additional reason for caution is the operational performance in 2011:
Figures in $ Millions
The reduction in operating income operating income was principally due to a goodwill impairment charge in the Natural Gas Storage business unit. I was disturbed by the size of the write-off ($170 million on the ~$440 million Lodi acquisition made in mid-2007) and the fact that in 2011 BPL missed consensus estimates every single quarter. Also of concern is the Federal Energy Regulatory Commission (FERC) order of March 30, 2012, that disallowed proposed rate increases on the Buckeye System that would have become effective April 1, 2012. The proposed rate increases were expected to increase BPL’s annual revenues (and, I presume, EBITDA) by approximately $8 million.
Finally, investors should note a new risk factor appearing in the recent 10-K.with respect to the Bahamas Oil Refining Company International Limited (BORCO) acquired in late 2010 and early 2011 for ~$1.7 billion. In 2011 approximately 46% of BORCO’s total revenue was derived from its three largest customers (22% from its largest single customer). Going forward, the reliance on the three largest customers is expected to continue.
- English (UK)
- English (India)
- English (Canada)
- English (Australia)
- English (South Africa)
- English (Philippines)
- English (Nigeria)
- Deutsch
- Español (España)
- Español (México)
- Français
- Italiano
- Nederlands
- Português (Portugal)
- Polski
- Português (Brasil)
- Русский
- Türkçe
- العربية
- Ελληνικά
- Svenska
- Suomi
- עברית
- 日本語
- 한국어
- 简体中文
- 繁體中文
- Bahasa Indonesia
- Bahasa Melayu
- ไทย
- Tiếng Việt
- हिंदी
BPL: A Closer Look at Buckeye Partners’ 2011 Distributable Cash Flow
Published 04/09/2012, 04:24 AM
Updated 07/09/2023, 06:31 AM
BPL: A Closer Look at Buckeye Partners’ 2011 Distributable Cash Flow
3rd party Ad. Not an offer or recommendation by Investing.com. See disclosure here or
remove ads
.
Latest comments
Install Our App
Risk Disclosure: Trading in financial instruments and/or cryptocurrencies involves high risks including the risk of losing some, or all, of your investment amount, and may not be suitable for all investors. Prices of cryptocurrencies are extremely volatile and may be affected by external factors such as financial, regulatory or political events. Trading on margin increases the financial risks.
Before deciding to trade in financial instrument or cryptocurrencies you should be fully informed of the risks and costs associated with trading the financial markets, carefully consider your investment objectives, level of experience, and risk appetite, and seek professional advice where needed.
Fusion Media would like to remind you that the data contained in this website is not necessarily real-time nor accurate. The data and prices on the website are not necessarily provided by any market or exchange, but may be provided by market makers, and so prices may not be accurate and may differ from the actual price at any given market, meaning prices are indicative and not appropriate for trading purposes. Fusion Media and any provider of the data contained in this website will not accept liability for any loss or damage as a result of your trading, or your reliance on the information contained within this website.
It is prohibited to use, store, reproduce, display, modify, transmit or distribute the data contained in this website without the explicit prior written permission of Fusion Media and/or the data provider. All intellectual property rights are reserved by the providers and/or the exchange providing the data contained in this website.
Fusion Media may be compensated by the advertisers that appear on the website, based on your interaction with the advertisements or advertisers.
© 2007-2024 - Fusion Media Limited. All Rights Reserved.
