Back in June, China’s federal bond yield curve inverted. Ahead of mid-year bank checks, short-term govvies sold off as longer bonds continued to be bought. It was for some a rotation, for others a reflection of money rates threatening to spiral out of control. On June 19, for example, the 6-month federal security yielded 3.87% compared to a yield of 3.525% for the 10 year.
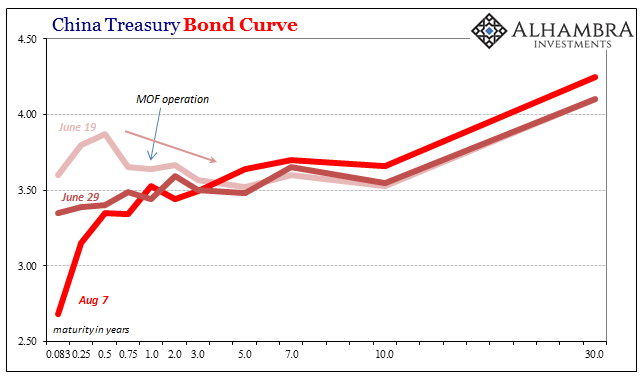
Several liquidity operations as well as symbolic intervention by the Ministry of Finance (at the 1s) eventually wrested control of the yield curve. By July, China’s government curve, which has never really been textbook pretty, was back to a more normal shape. Money rates were behaving again and more so USD/CNY’s ascent continued undaunted (projecting confidence).
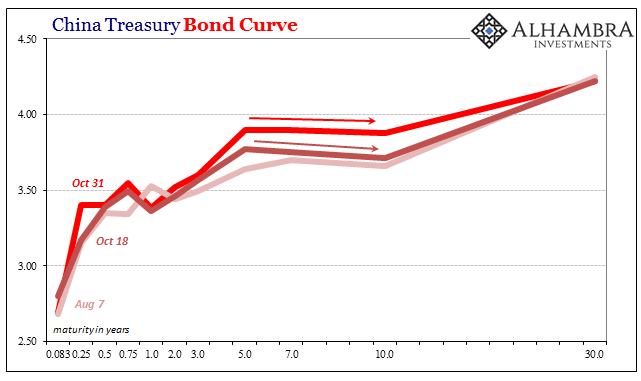
As those took shape, China’s bond market sold off in general. Government bond yields have been rising across the curve but mostly in the all-important middle. The 5-year rate that had been 3.48% as late as June 29 was 3.90% yesterday. The 10s that were 3.55% then are 3.88% now. Thus, China’s government bond curve is inverted again, but this time where it really counts.
As is usual in these circumstances, but especially with regard to anything China, the mainstream West is quick to re-assure.
China’s bond market has just turned upside down again. But unlike in the U.S. — where an inverted yield curve can signal an impending recession — there’s much less reason for President Xi Jinping to worry.
That’s because the anomaly is pretty much government-driven, with the central bank driving short-term rates higher to tamp down excessive leverage. Policy makers have stepped in on occasion to prevent excessive tightness, through cash injections or targeted easing. Yields also have climbed this week because of signs of an improving economy, with People’s Bank of China Governor Zhou Xiaochuan suggesting that growth may surprise to the upside. [emphasis added]
Even if the highlighted portion was true, for it to really be true the long rate would rise at least as far and as fast as the short rate in question. For the latter to go farther and faster than the former instead suggests, no, actually declares, serious market doubts as to whether improvement is meaningful.
Inversion in the 5s and 10s is about long versus short, bonds as well as economy. Five years and in reflects perceptions about what is happening right now; five to ten, the curve space where almost all the real money goes, the belly, is about how the short run may affect ultimately the long run – or not.
In other words, rising nominal rates as the 5s10s flattens and/or inverts suggests that the bond market perceives perhaps better economic growth now (or, alternately, lack of PBOC money market control), but that it won’t last much beyond now. In terms of China’s economic history the past five or six years, maybe Governor Zhou is right (for once) and that Chinese growth “may surprise to the upside” but it won’t be the kind of acceleration that changes China’s dangerous zero-growth economic baseline.
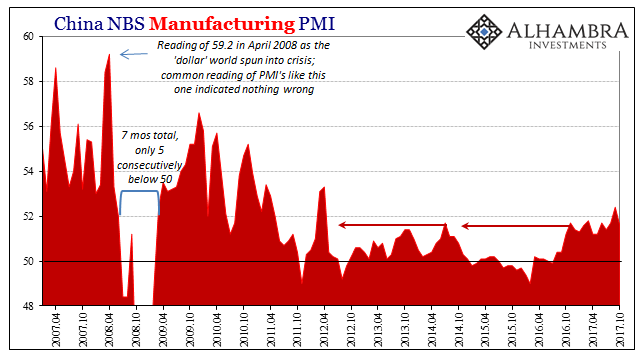
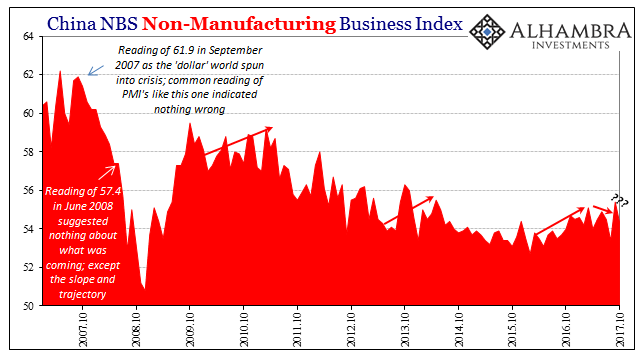
China’s just-released official PMI estimates for October show us just that potential. After rising suspiciously just before the start of the 19th Party Congress, both the manufacturing (51.6 in October vs. 52.4 September) as well as the non-manufacturing (54.3 in October vs. 55.4 September) PMI fell back this month. The former version was slightly less than the reading for August, while the latter is right back at the same low average level for the last year.
There isn’t any acceleration in the headline indices, and underneath them are continued troubling signs. The manufacturing PMI for large Chinese industrial firms was a relatively decent 53.1 in October, but for small and medium firms the readings are still concerning, 49.0 and 49.8, respectively. That is surely the remnants of Chinese “stimulus” begun in early 2016 which flowed mostly into state-owned channels with little making an impact beyond.
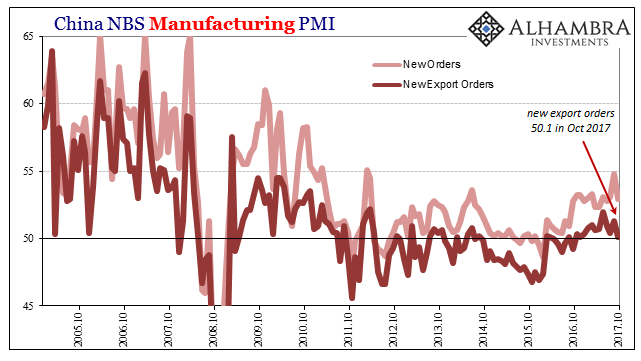
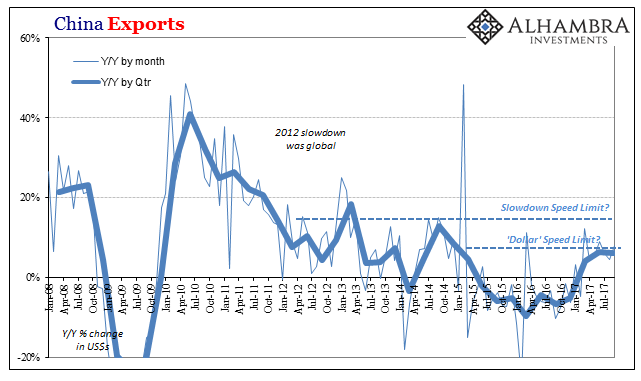
New export orders for manufacturing firms also fell back in October. Rising only to 50.9 in July, this subcategory is right back at 50.1 in October. So much of the mainstream economic hype, even for China, is predicated on the ubiquitous but ephemeral “global growth.” There just isn’t any basis for that hope as we find time and again in data (exports) far more tangible and solid than PMI's.
With that in mind, China’s government bond curve inversion is simply acknowledging these doubts that the media easily glosses over (and over and over). Some things never change, including how economists don’t get bonds in any country.
