
First the ECB, then the Fed, and now here comes the BoJ cavalry, but the market is not responding with much enthusiasm after the overnight pop. Was that the move for now or is there more to come?
BoJ effect not holding…
Only a minority were expecting the BoJ to ease again at this meeting, but apparently the central bank felt justified in moving at this time due to the recent soft numbers and even explicitly due to the strength of the JPY. It’s interesting, therefore, that all of the JPY downside seems to have been in the anticipation, rather than the reality, of QE, even if its timing was a surprising moved forward, as I discuss below.
The most interesting thing here: are we already seeing the end of the rally in risk/sell-off in the USD and JPY off the back of the Central Bank triple whammy of QE cubed? The next week tells us the answer. If we settle into a boring range, we might see another surge in the pro-risk trade/carry trades, but if the momentum picks up again over the next two or three days to the downside, the highs may be in.
Chart: EUR/JPY
So overnight we have Japan promising another ¥10 trillion (about $125 billion for those tired of all the zero’s involved) in Japanese government paper purchases – a move that was generally anticipated, just “not yet,” but perhaps the recent USD/JPY visit below 78.00, even if it was for just a day, was heating the seats up at the BoJ. Anyway, the interesting thing today was how the market took the news, as JPY crosses knee-jerked sharply higher but then in many cases posted new three day lows by later in the European session, a sure sign that the market is becoming a two-way one again after the recent rush higher in most JPY crosses.
Note the pattern reversal for EUR/JPY so far this week, which may begin to carve out a range now. To the downside, the 40-week (200-day) moving average comes in at 101.85, still way above the TenKan line. Overhead, the Ichimoku cloud looms a bit higher.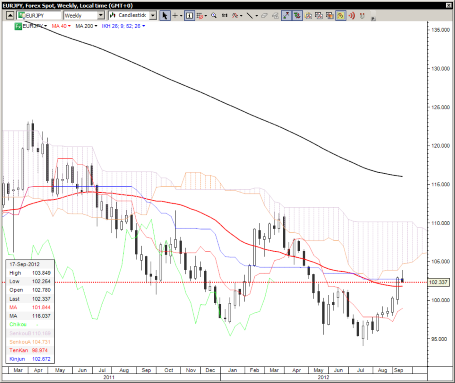 EUR/JPY" title="EUR/JPY" width="455" height="383">
Careful on the kiwi …eventually
While the kiwi has seen run away upside lately on the weak aussie and on the endless money-printing theme, the terrible current account deficit is a reminder that the currency is highly vulnerable from a foreign investor angle, should any significant number of those foreigners decide to pull out. And if/when they do, they will need liquidity in the currency that just won’t be there.
Whenever trading kiwi, “Remember 2007” should always be the call (the brief meltdown in kiwi was particularly brutal that year compared to other carry trades – so bad that Mrs. Watanabes decided that it was safer to stick with AUD/JPY and abandoned NZD longs – then the AUD/JPY meltdown in 2008 was vastly worse than the NZD/JPY meltdown as AUD/NZD was bludgeoned for more than 10% in about two weeks during the worst of the post-Lehman meltdown. It would appear that NZD is getting popular again, which will be a dangerous thing eventually.
Stay tuned. No signs of trouble so far with complacency absurdly high of late after all of the Taleb wannabe’s are going out of business and being forced to abandon their tail risk trades by the world’s central banks. The technical situation only gets interesting in the short term below 0.8200 in NZD/USD, for example, and even then, we’re talking about a basic sell-off risk – the “big move” out there on the horizon will need some kind of trigger.
Looking ahead
EUR/USD, as of this writing at least, has nominally survived an attack on the 1.3000 level, but there is a lot more room for consolidation without threatening the recent move up, as we would have to work all the way back below the 1.2750 area to really talk full scale reversal. The AUD/USD situation is interesting as it is in an important pivot zone that may determine the medium term outlook, as I covered this morning. US housing starts were surprisingly soft, though the building permits are still going strong and the most recent NAHB survey released yesterday – the most leading of the major indicators – was still going strong.
Let’s watch the technical activity and how the market reacts tomorrow on the Philly Fed and jobless claims numbers – this could be an interesting “taking of the pulse” for the short-term on how much confidence in risk instruments the Fed’s QE3 continues to inspire, or not.
Economic Data Highlights
- New Zealand Q2 Current Account Balance out at -1.8B vs. -1.6B expected and -1.1B in Q1
- Japan BoJ expands asset purchases ¥10 trillion vs. no change expected
- Eurozone July Construction Output out at -0.3% MoM and -4.7% YoY vs. -2.8% YoY in June
- Switzerland September Credit Suisse Survey out at -34.9 vs. -33.3 in August
- US August Housing Starts out at 750k vs. 767k expected and 733k in July
- US August Building Permits out at 803k vs. 796k expected and 811k in July
- Canada August Teranet/National Bank Home Price Index out at +0.2% MoM and +4.1% YoY vs. +4.8% YoY in July
- US August Existing Home Sales (1400)
- US Weekly DoE Crude Oil and Product Inventories (1430)
- New Zealand Q2 GDP (2245)
- US Fed’s Fisher to Speak (2300)
- Japan August Merchandise Trade Balance (2350)
- Australia Westpac ACCI Survey of Industrial Trends (0100)
- China September HSBC Flash Manufacturing PMI (0230)
- Japan BoJ Monthly Economic Report (0500)
- Japan August Nationwide Department Store Sales (0530)