Get 40% Off
🚨 Volatile Markets? Find Hidden Gems for Serious Outperformance
Find Stocks Now

Bears Take Control As 200DMAs Tested

Published 04/03/2018, 12:17 AM
Updated 07/09/2023, 06:31 AM

Traffic to my site has doubled over the last three days as 'panic reading' takes hold of the market. Such spikes in readership have in the past acted as good points for a near-term bottom, although yesterday's action does not suggest as such.

The S&P and Dow Jones both offered breakdowns from their respective 'bear flags'. The S&P broke from the 'bear flag' and closed just below its 200-day MA. Volume climbed in distribution although there is enough to suggest this could be a support level.
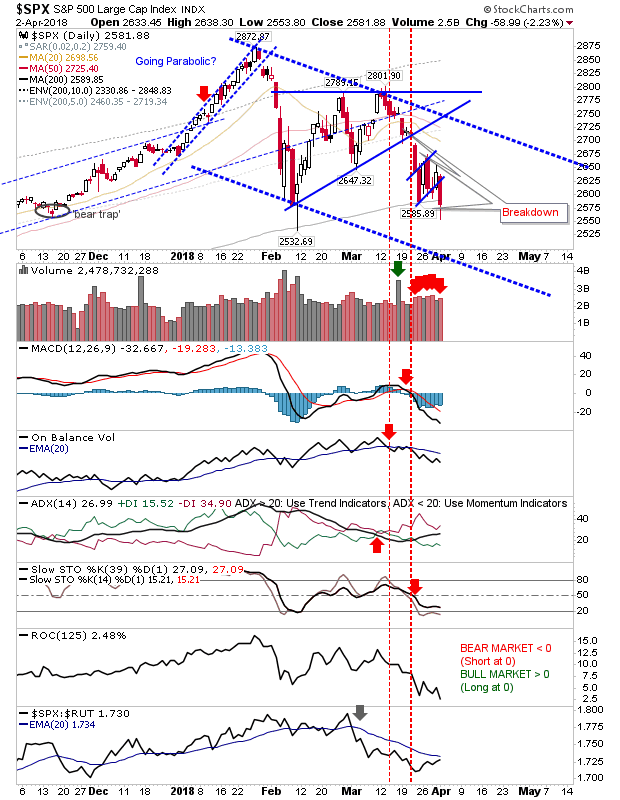
SPX Daily Chart


The Dow Jones Industrial average did break its 'bear flag' but didn't lose its 200-day MA. With the sharp uptick in relative performance (against Tech averages) there is a chance yesterday's tag of the 200-day MA will act as a launch point of a rally. Today could offer a 'hammer' or 'doji' spike low which moves below - but finishes above - its 200-day MA. Stochastics are oversold enough for a bounce to emerge.
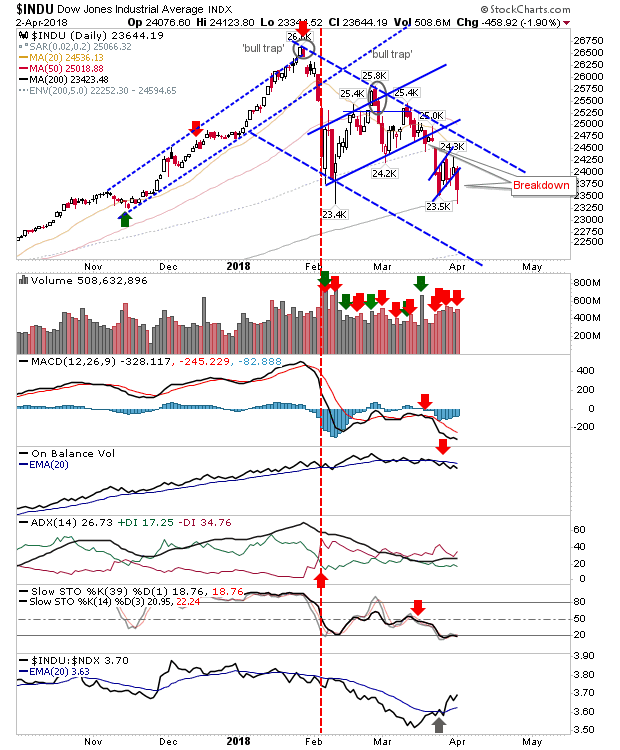
INDU Daily Chart


The NASDAQ gave up close to 3% but didn't tag its 200-day MA. I still like the 200-day MA as a bounce zone but it could still be a few days before it's tested; stochastics are still a long way from oversold. Relative performance is falling sharply which will make calling a bounce more difficult.
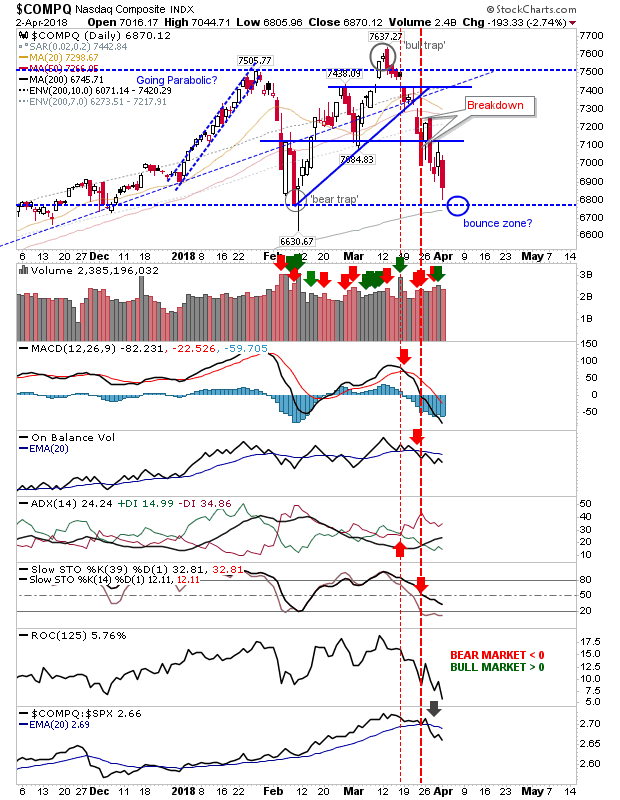
COMPQ Daily Chart


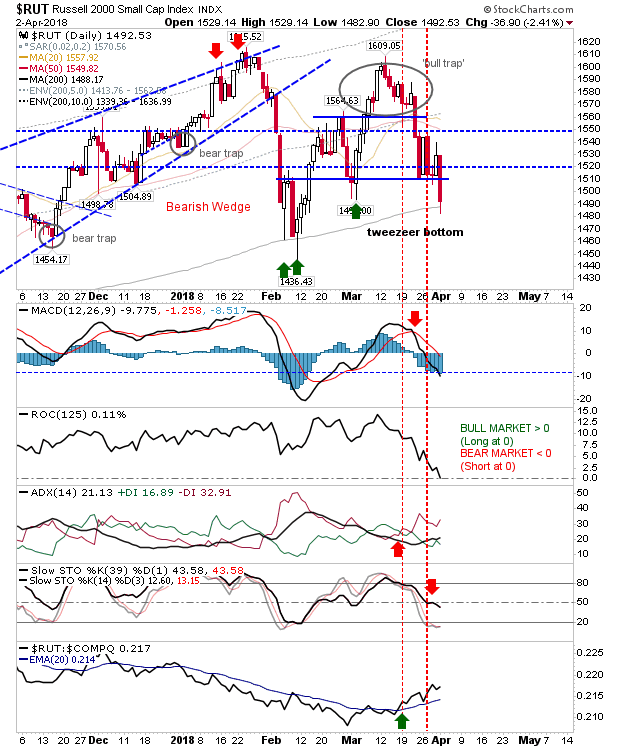
The Russell 2000 did tag its 200-day MA as it undercut the 'tweezer bottom'. The opportunity for a bounce off the bullish stochastic 'mid-line' weakened with yesterday's dip below this mid-line. The silver lining is the relative performance of the index which continues to gain. For the next rally, look for leadership from Small Caps but it might be a tough sell, to begin with.
3rd party Ad. Not an offer or recommendation by Investing.com. See disclosure here or remove ads .

RUT Daily Chart


For today, for indices near 200-day MAs it will be important for them to close at or above this key average - but intraday moves below this moving average can and should be expected.

Latest comments

Btfd!
Risk Disclosure: Trading in financial instruments and/or cryptocurrencies involves high risks including the risk of losing some, or all, of your investment amount, and may not be suitable for all investors. Prices of cryptocurrencies are extremely volatile and may be affected by external factors such as financial, regulatory or political events. Trading on margin increases the financial risks.
Before deciding to trade in financial instrument or cryptocurrencies you should be fully informed of the risks and costs associated with trading the financial markets, carefully consider your investment objectives, level of experience, and risk appetite, and seek professional advice where needed.
Fusion Media would like to remind you that the data contained in this website is not necessarily real-time nor accurate. The data and prices on the website are not necessarily provided by any market or exchange, but may be provided by market makers, and so prices may not be accurate and may differ from the actual price at any given market, meaning prices are indicative and not appropriate for trading purposes. Fusion Media and any provider of the data contained in this website will not accept liability for any loss or damage as a result of your trading, or your reliance on the information contained within this website.
It is prohibited to use, store, reproduce, display, modify, transmit or distribute the data contained in this website without the explicit prior written permission of Fusion Media and/or the data provider. All intellectual property rights are reserved by the providers and/or the exchange providing the data contained in this website.
Fusion Media may be compensated by the advertisers that appear on the website, based on your interaction with the advertisements or advertisers.
© 2007-2024 - Fusion Media Limited. All Rights Reserved.