Everyone seems to be in a state of panic following the recent correction for bitcoin as my inbox floods with messages asking for my opinion on the situation, which I don't mind as I love helping out other traders where possible.
This recent move really doesn't concern me as all of the technicals on the higher timeframes still indicate the uptrend is intact.
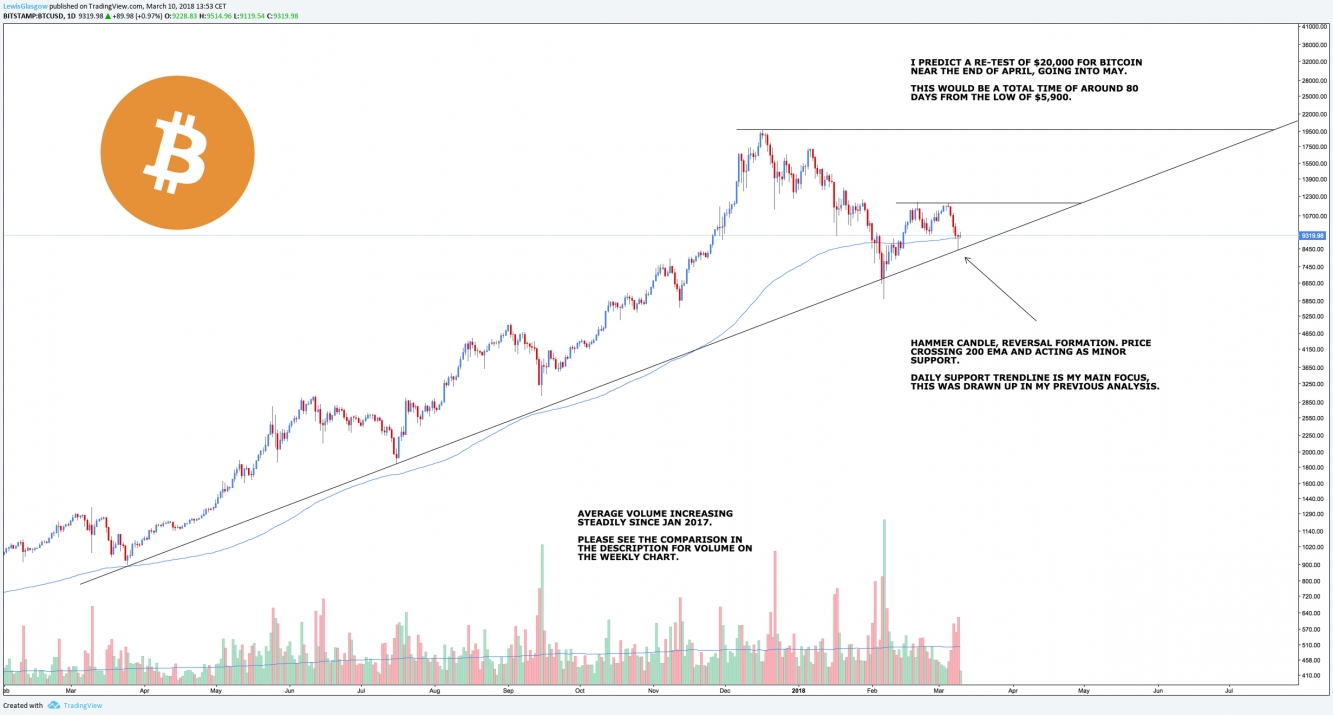
As you can see from the daily chart the support trendline which I presented in my previous analysis on market cycles is still holding, price has returned to this daily support at $8,360.
As many of you know I use a logarithmic scale when analysing cryptocurrencies (just in case you are confused about the appearance of my charts).
I suggest anyone who has not read my coverage on bitcoin they do so now.
I'm always asked by my followers "when will we see price return to 20k?" or "when will btc moon?"
This is why I've placed my prediction for $20,000 on the charts which in my opinion will occur in the last week of April going into May, as long as we stay on track, if my opinion changes I will let you all know. Never be stuck with one opinion and fail to see the errors in your own workings, I'm an open-minded trader that analyses all potential risk.
There is one point I would like to correct and that is people who continually say "BTC is rising on falling volume" and there is some truth to that in comparison to previous trading years but if you look at the daily chart you can see the average volume has been increasing steadily since Jan 2017.
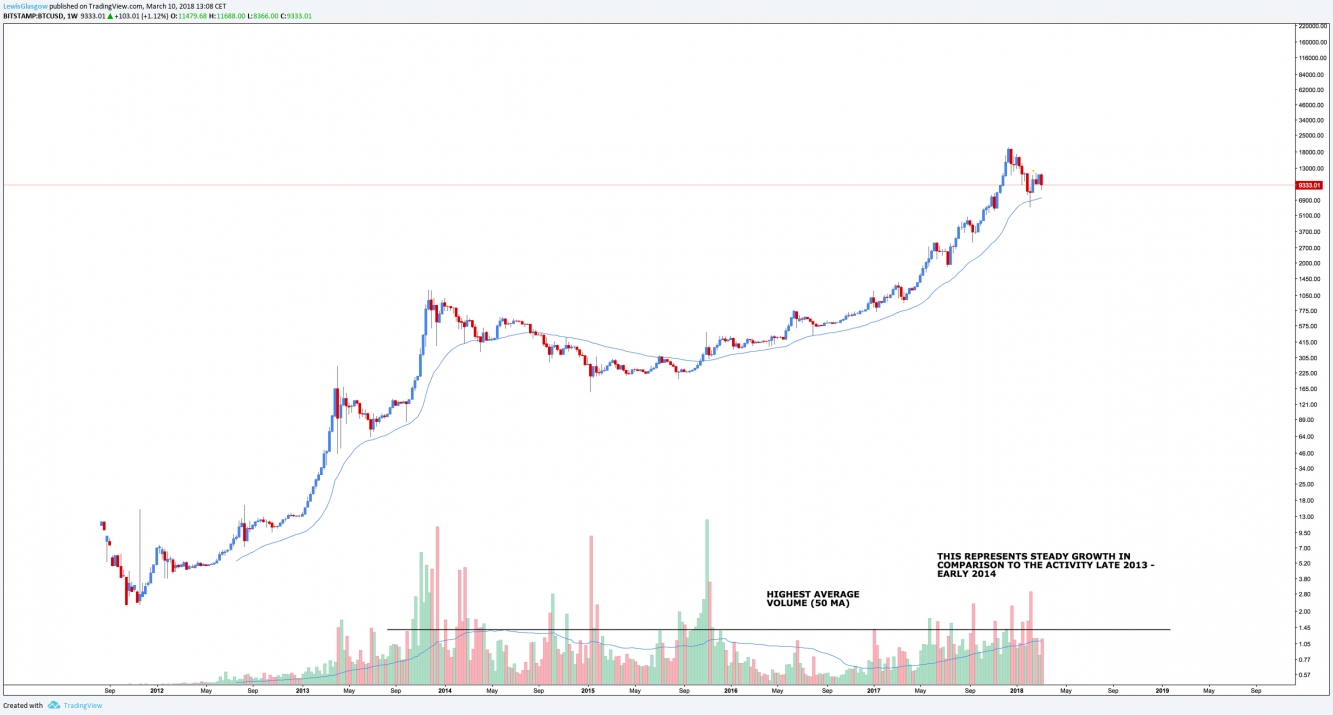
Taking a look at the weekly chart below we can see that the average volume is quickly approaching the highest average volume during 2014, I believe we will pass this area this year when BTC creates a new all time high. The current trend in volume represents steady growth just like the volume shown on the daily chart.
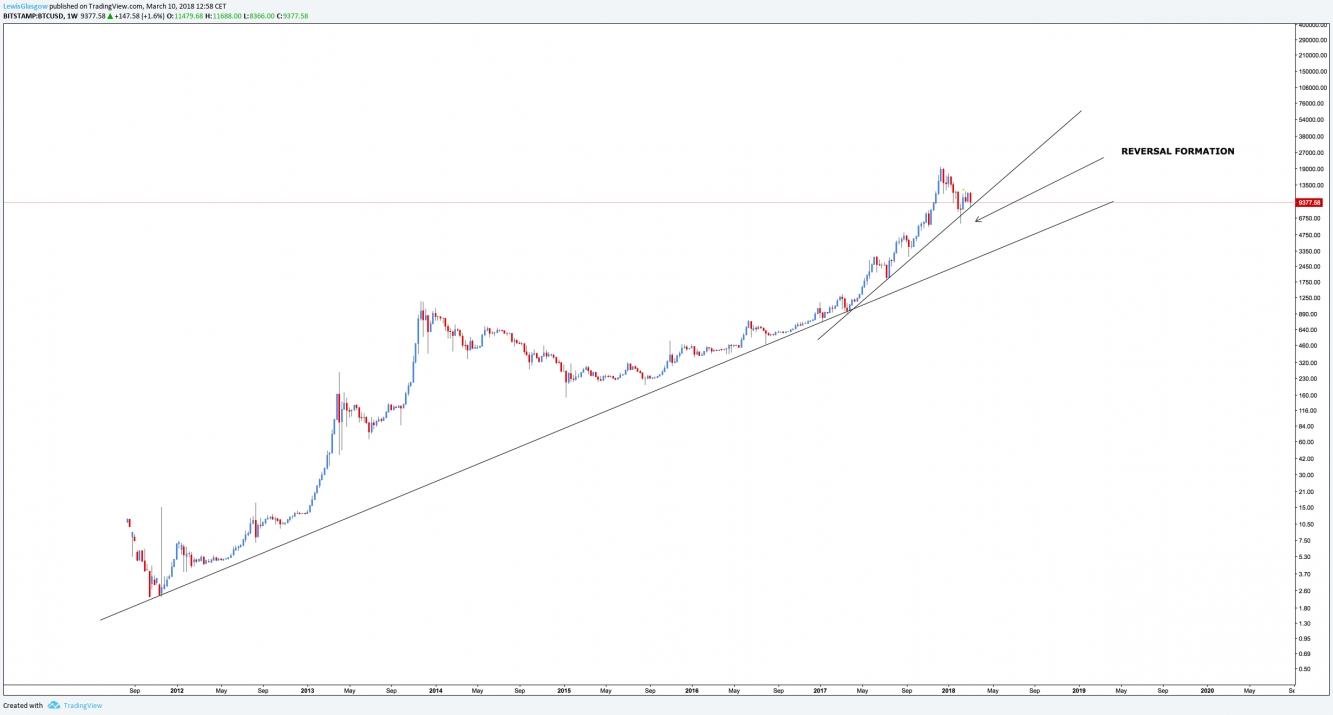
Below is the weekly chart showing basic price structure with the daily support trendline and the lower support trendline on the weekly.
If we did see any major downside for bitcoin this is the chart I would refer to, however, I do not see this happening.
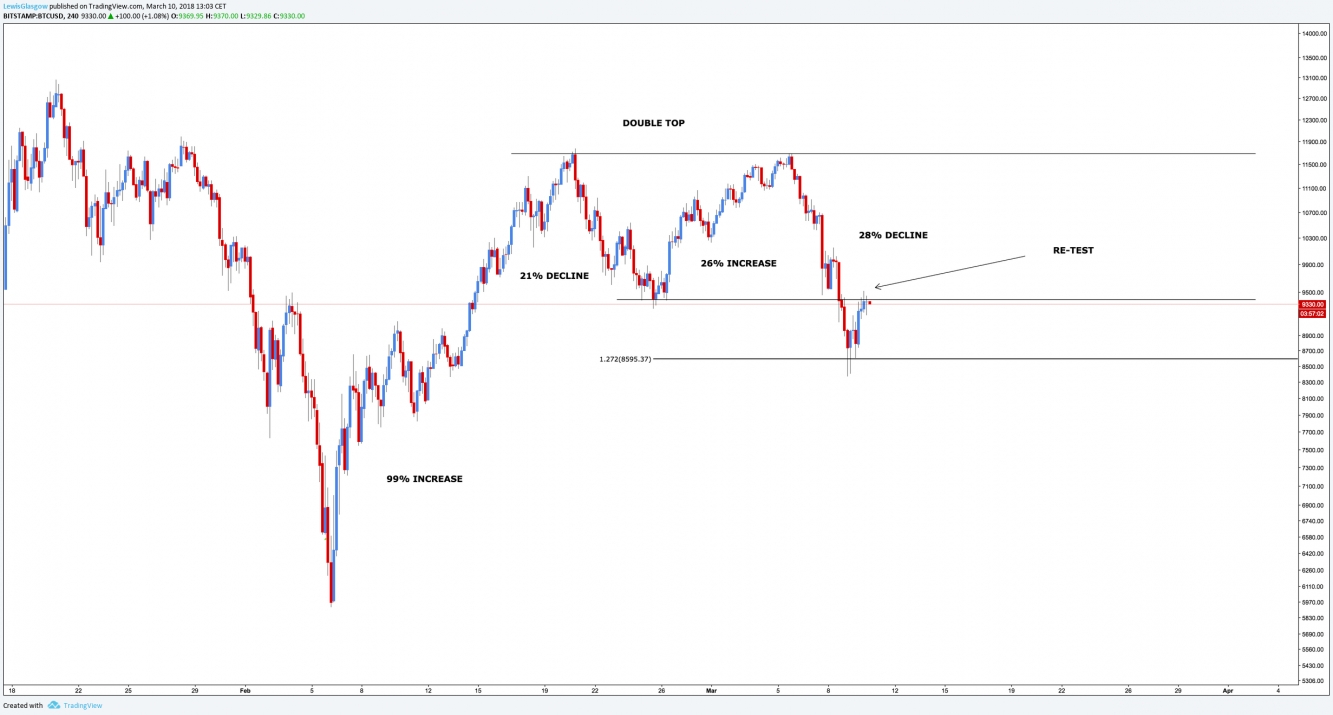
To finish off this analysis here is my view on the 4h chart, we can see that price increased by 99% followed by a 21% correction, then a 26% increase creating a double top formation which caused the decline of 28% to the low of $8,360 which formed at the 1.272 projection.
Price is now re-testing resistance, pay close attention to this level for short-term direction, failing to close above would indicate another move back down to the daily support trendline.
That's it from me, I hope you all gained value from my analysis.
Feel free to leave your opinion below.


