Throughout its history, the Bitcoin price has had numerous repetitive patterns. While they are not as easily identifiable in their early stages, they become more apparent as they continue to develop. Additionally, trading inside a range can either be bullish, bearish or a period of consolidation.
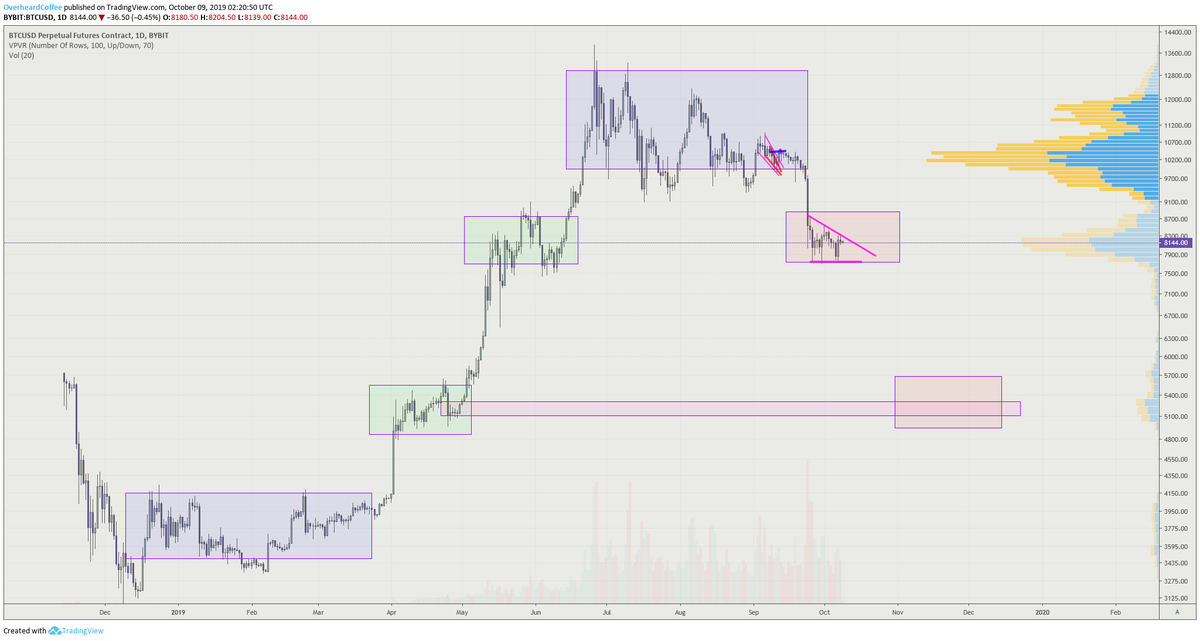
Since September 24, Bitcoin has been trading inside a range of $7700-8700 within the confines of a bearish descending triangle — out of which a breakdown would be customary. Throughout May and June, we had a bullish trading period inside the same range before breaking out and reaching the eventual $13,764 high.
Well-known cryptocurrency commentator @overheardcoffee noted some repetitive patterns in 2019 and outlined significant support and resistance areas.

Additionally, he alluded that we are going down from the current move while outlining the support area which we are likely to reach — but how likely is that? Let’s take a deep dive into the price action and analyze the possibility.
Moving Averages
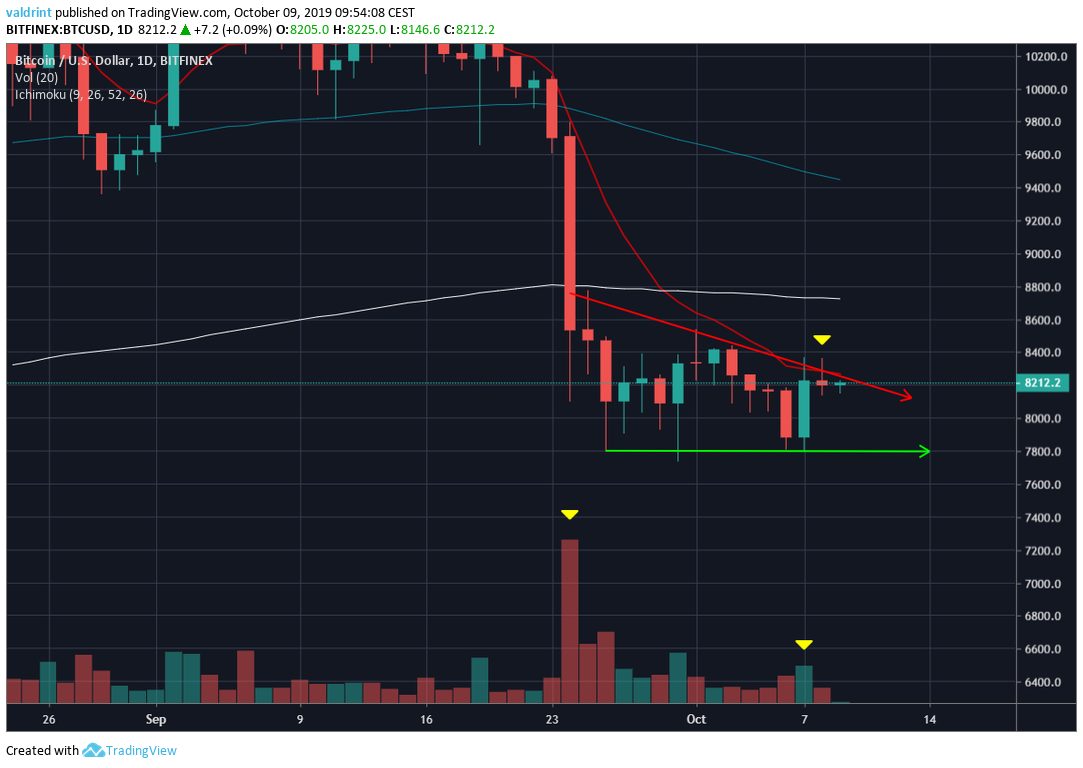
As stated previously, the Bitcoin price is trading inside a descending triangle.
When we look at the moving averages (MA), we can see that the BTC price is trading below both the short (10-day) and long-term (100-, 200-day) MAs. Additionally, they have made several bearish crosses.
Furthermore, while on October 7 the Bitcoin price created a bullish candlestick, it had extremely low volume — reducing the possibility of an upward move.

Finally, once the price reached the 10-day MA (which coincides with the resistance from the descending triangle), it immediately created a long upper wick and began to move downwards.
The combination of these signs points to a breakdown.
Evidence of a Bitcoin Price Breakdown
When looking at the previous price movement, our breakdown hypothesis is further strengthened.
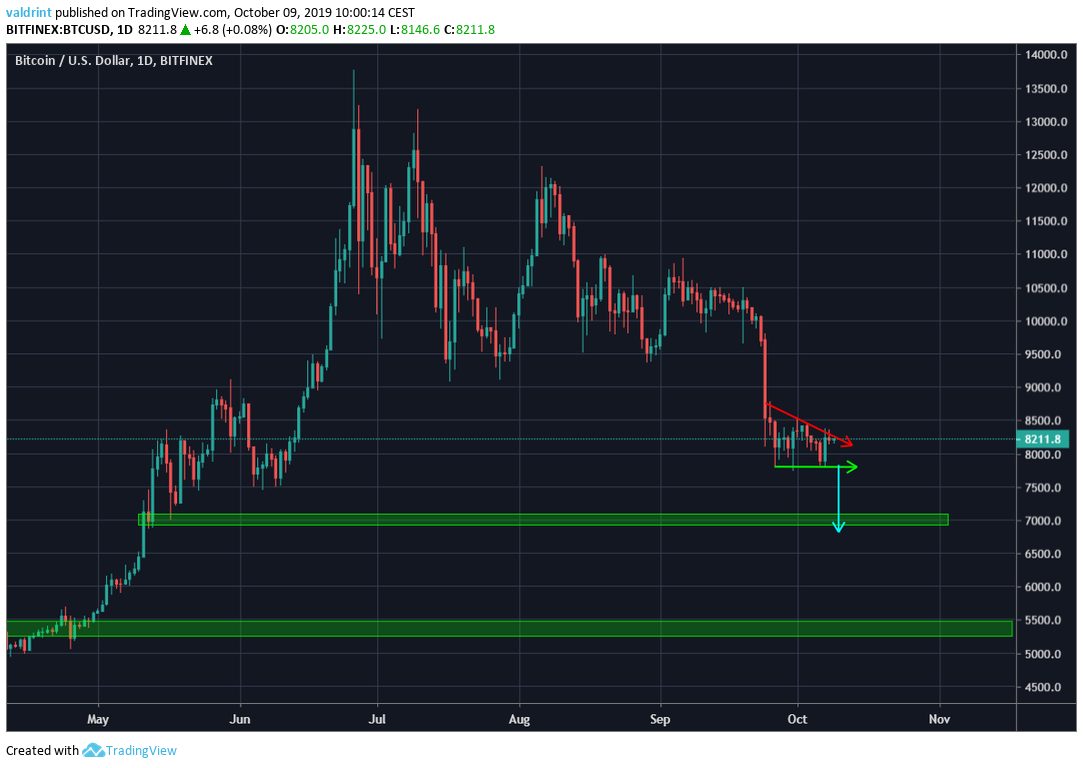
The current descending triangle transpiring after a rapid downward move and a downtrend that has been in place for 105 days. Therefore, it would be extremely uncommon to experience a breakout from a bearish pattern following a bearish trend.
After rapid downward moves, even neutral patterns such as symmetrical triangles often act as continuation patterns — initiating a decisive movement in the same direction of the prior trend.
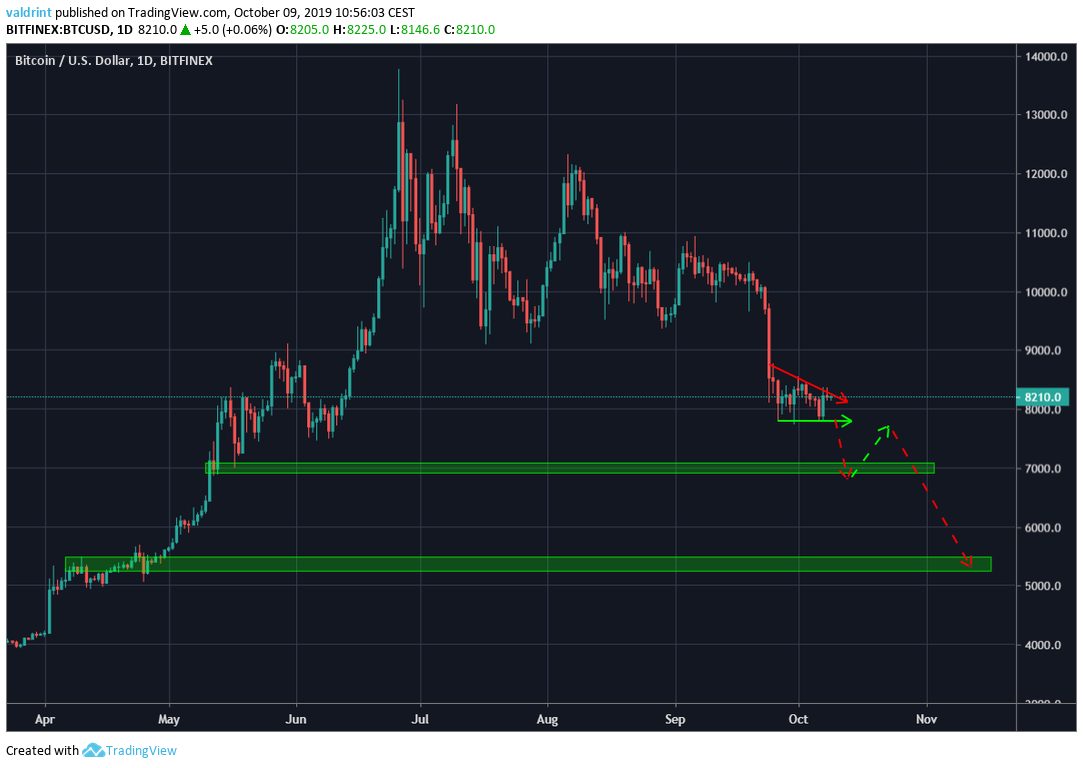
However, our breakdown target does not fit with the second support area outlined at $5400.

Projecting a breakout the height of the triangle, which is customary, gives us a target slightly below $7000 — fitting with the support area.
However, we are not dismissing the possibility of reaching $5400 — but if that target were to be reached, it is very unlikely that the breakdown would take us there without experiencing an upward bounce.

Summary
The Bitcoin price is trading inside a descending triangle for the past 15 days.
The current price movement suggests that the price will soon break down and reach the support area around $7000.
