
On June 4, 2019, the Bitcoin (BTC) price reached a high of $8498.59. A rapid decrease began and the price reached a low of $7449.4 the same day. Since then, it has been increasing, reaching highs of $8134.99 on June 7. After a gradual decrease, similar highs were reached on June 10 and 12.
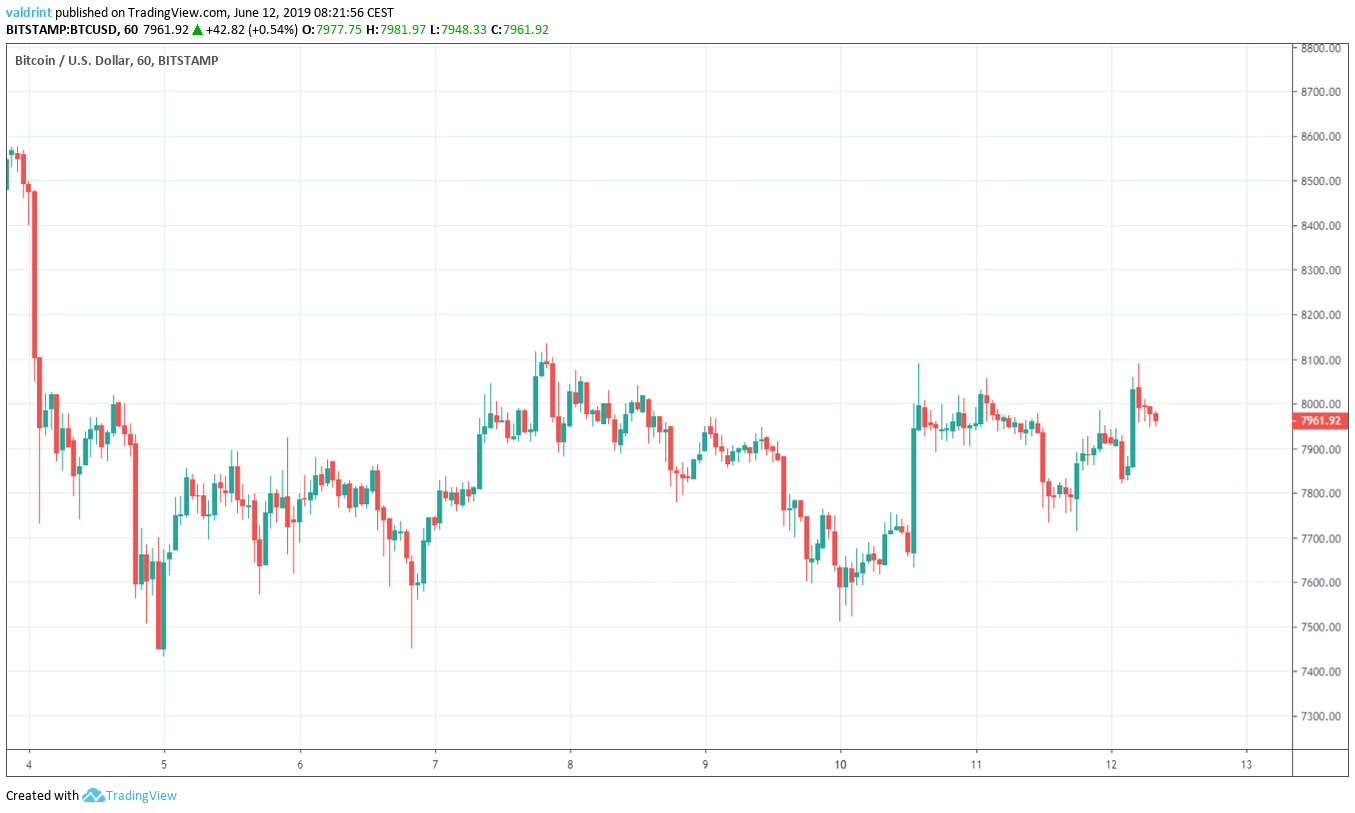
Will Bitcoin finally be able to break through the $8100 level? Keep scrolling below in order to find out.
Bitcoin Price (BTC): Trends and Highlights for June 12, 2019
- The price of BTC/USD reached a high on June 4.
- It is trading inside an ascending triangle.
- There is a bearish divergence developing in the RSI both in the short and long-term.
- The price is possibly creating a head and shoulders pattern.
- There is resistance near $8400.
BTC Price: Ascending Triangle
The price of BTC/USD on BITFINEX was analyzed at one-hour intervals from June 4 to June 12 in order to trace the current trading pattern.
On June 3, the BTC price reached an hourly high of $8103.63. A rapid decrease began the same day. The Bitcoin price reached lows of $7449.68 the same day. A gradual increase ensued.
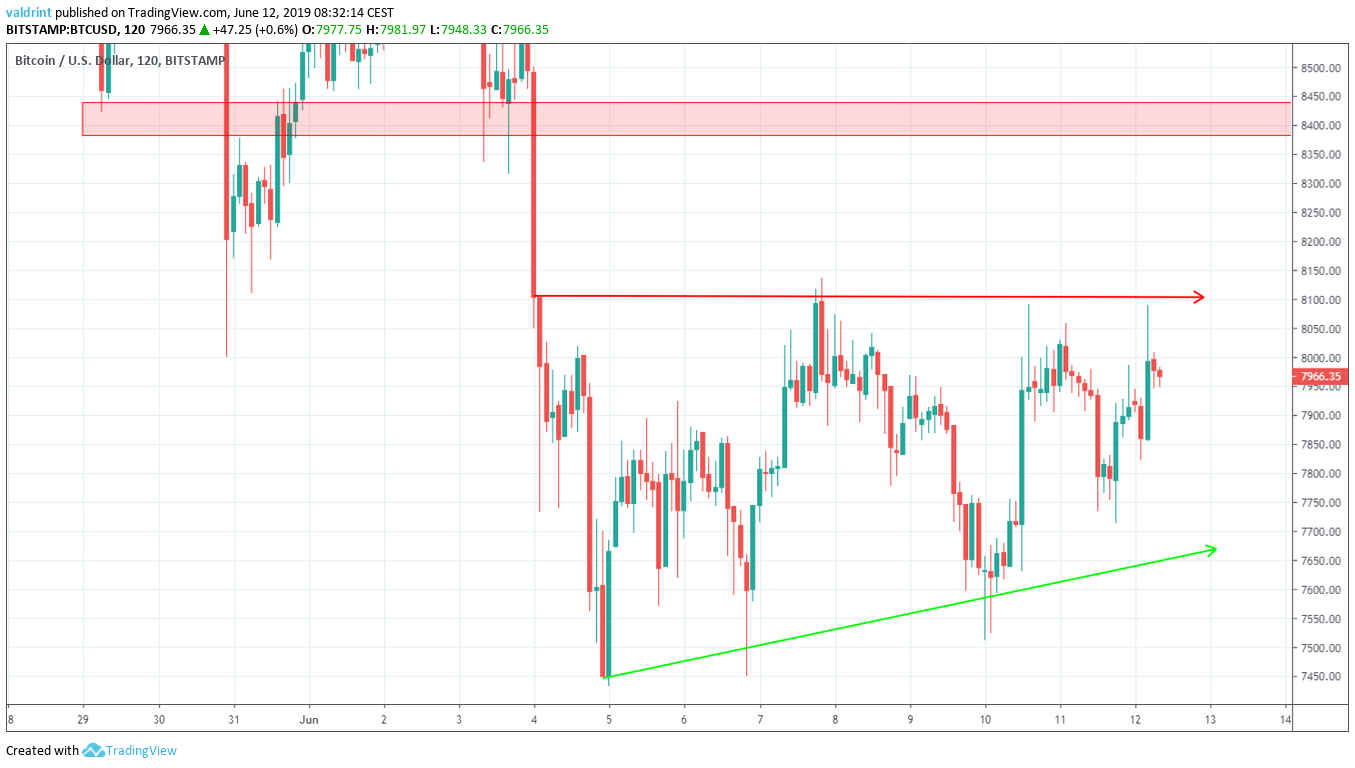
Since then, the price has been trading inside the ascending triangle outlined below:
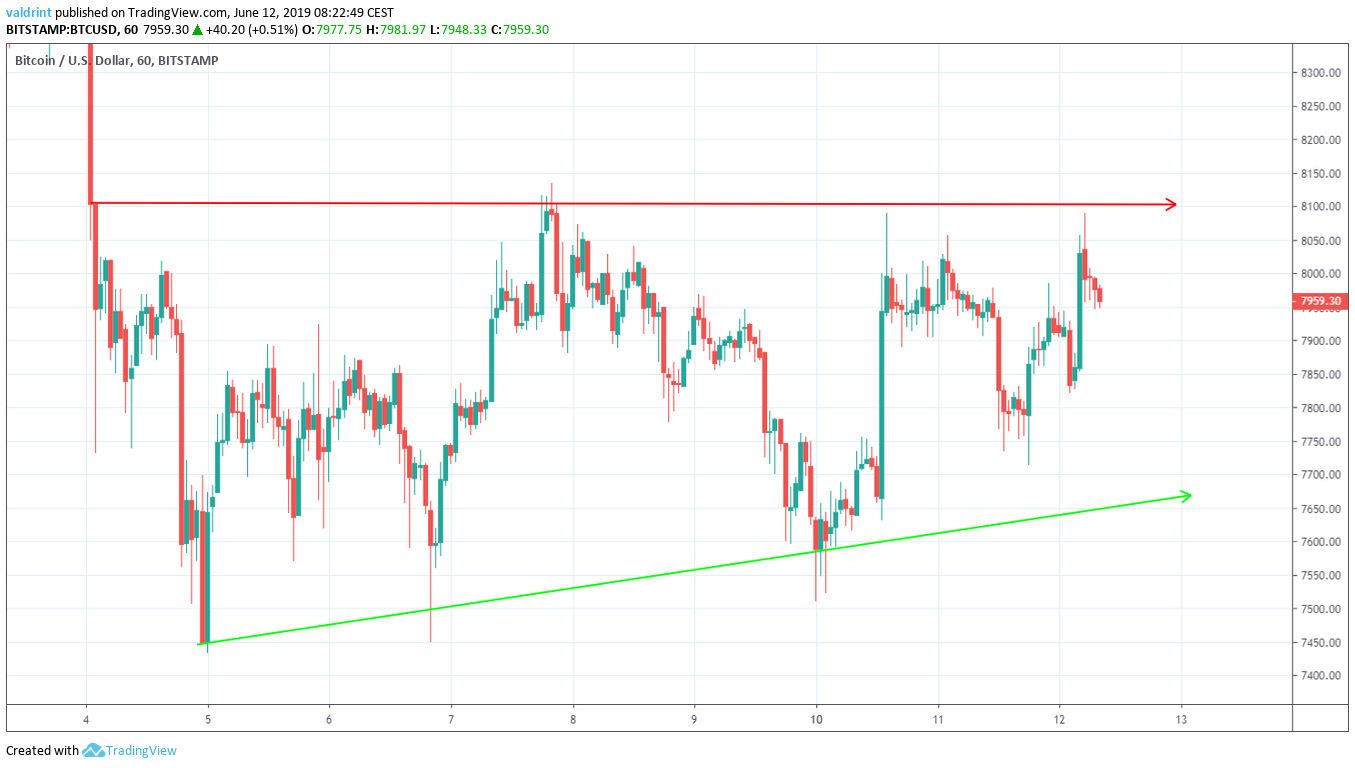 At the time of writing, the Bitcoin price was very close to the resistance line of the triangle. In the early hours of June 12, it touched the line for the fourth time. Will it break out?
A look at candlestick characteristics makes a breakout unlikely.
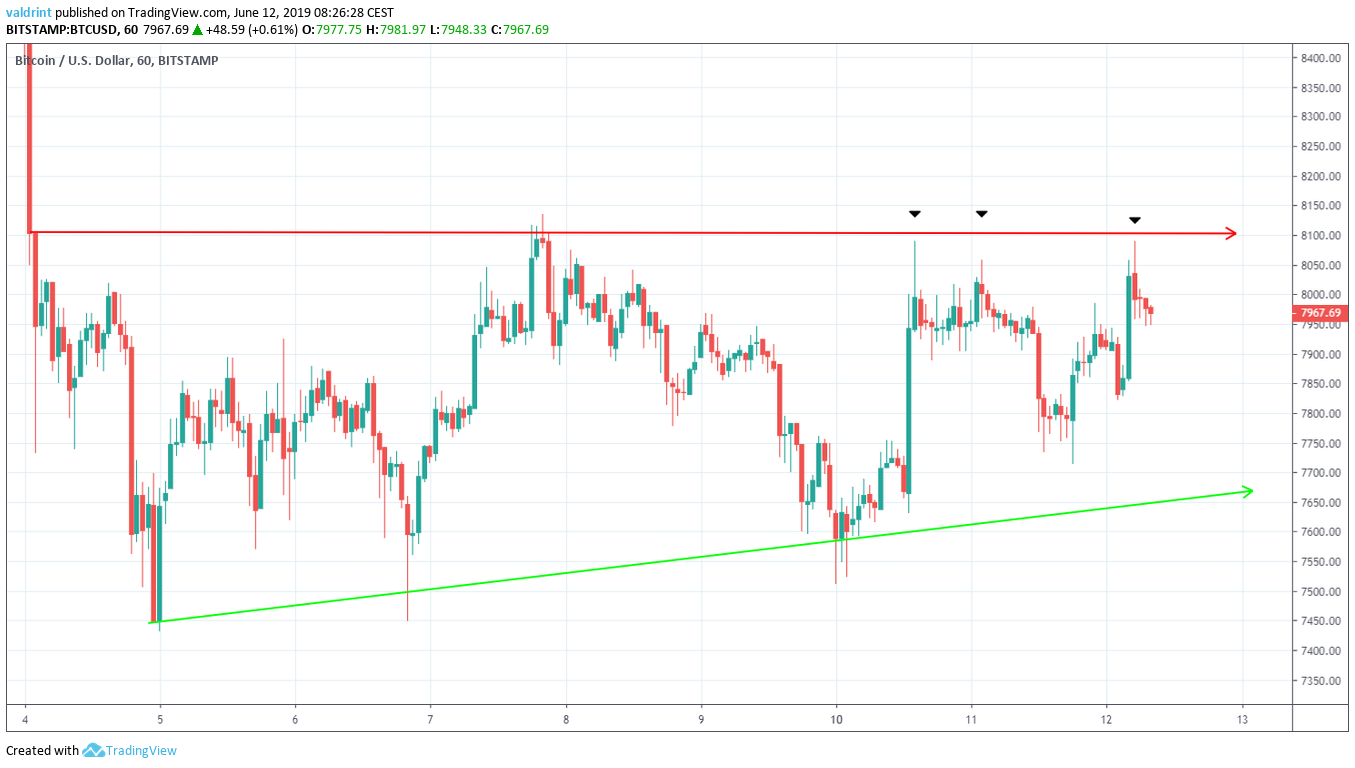
Candlesticks that reached values above $8000 were characterized by long upper wicks. This is an indication that there is significant selling pressure around this level. However, this alone is not sufficient in predicting Bitcoin price movements.
A look at technical indicators is required in order to do so.
Relative Strength Index
The BTC price is analyzed alongside the RSI in an hourly (first graph) and daily time-frame (second graph) below:
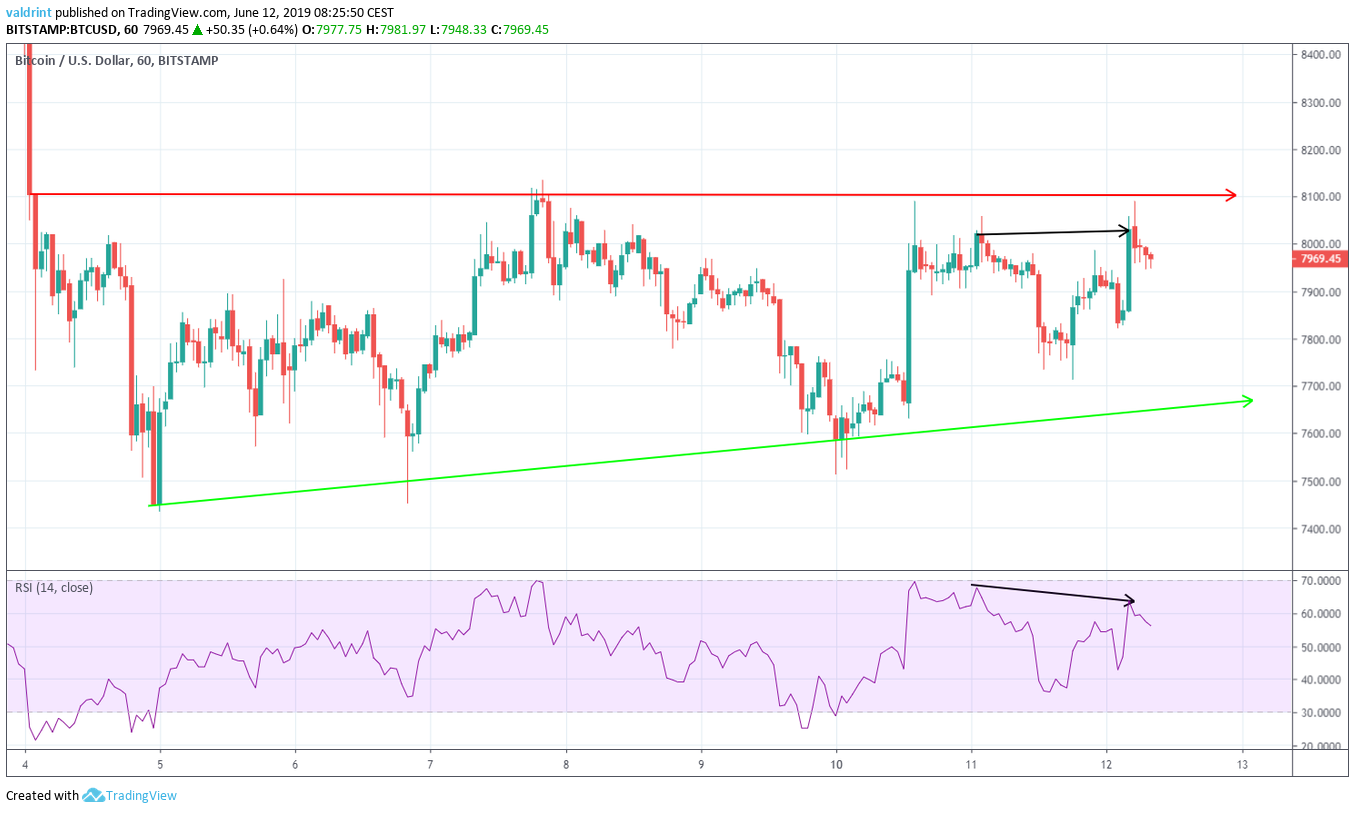
On June 11 and 12, the Bitcoin price twice touched the resistance line of the triangle. The RSI, however, created successive lower highs. This is known as bearish divergence and often precedes price decreases. However, it is only occurring in time-frames of two hours or less.
Furthermore, the ascending triangle is a bullish pattern, reducing the significance of the divergence.
However, an analysis of long-term moving averages gives a similarly bearish outlook.
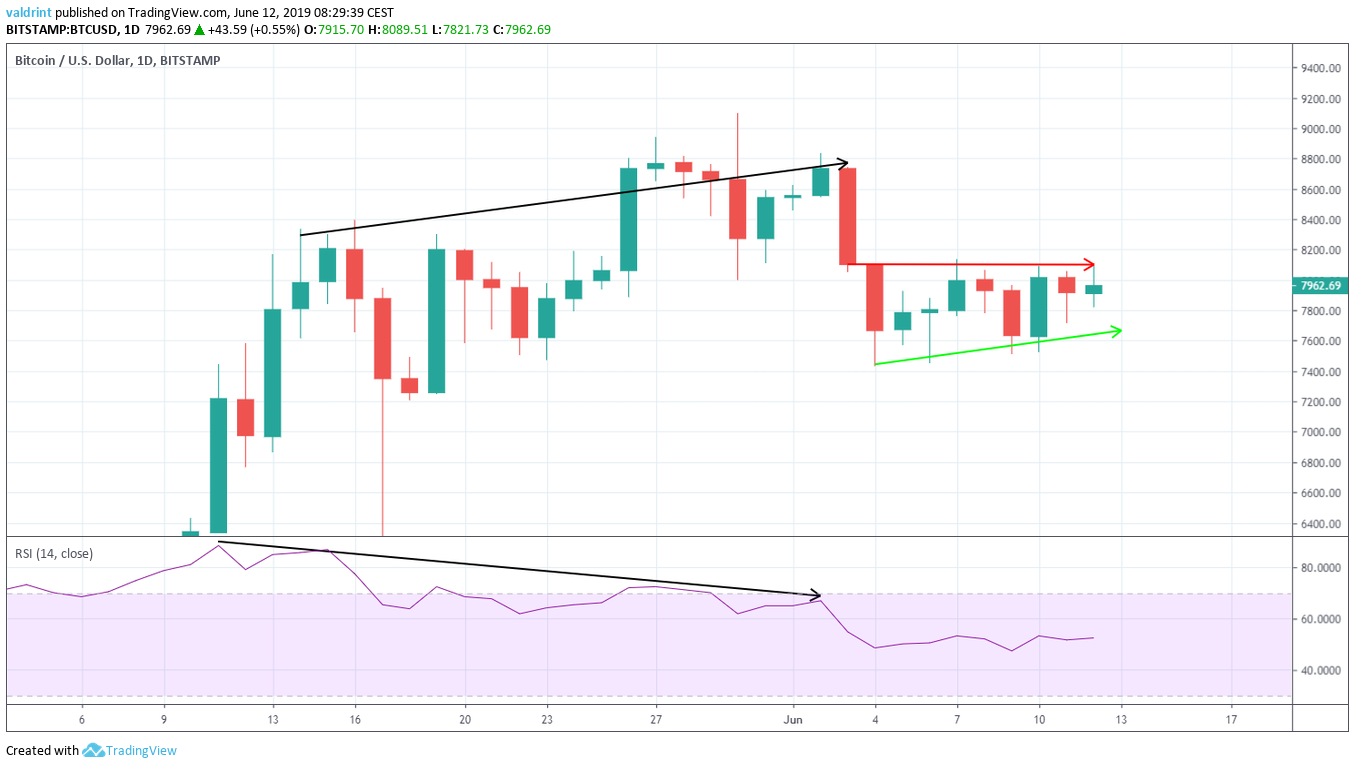
On May 14, the Bitcoin price reached a high of $8335.56. It continued to increase and on June 2 it reached a higher high of $8833.97. During this time, the RSI generated successively lower values.
A small decrease ensued shortly after. However, since the divergence occurred throughout a period of 19 days, it is likely that the BTC price has not finished decreasing.
The use of these indicators supports price decreases towards the support line of the triangle and a possible breakdown.
Head And Shoulders
However, the price is possibly creating a head and shoulders pattern. This is a bearish reversal pattern.
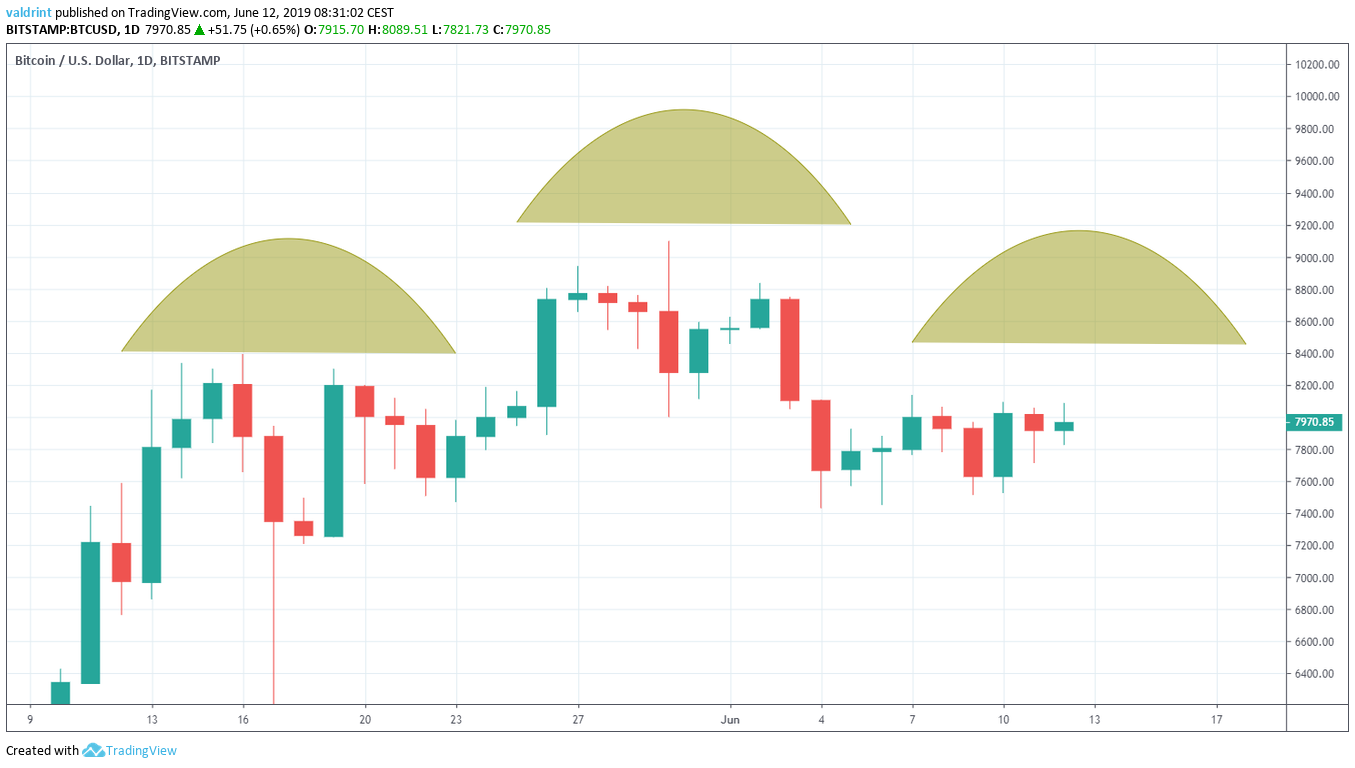
The pattern consists of the left shoulder (highs on May 15), the head (highs on May 30) and the right shoulder. For the right shoulder to be completed, the BTC price would have to break out of the triangle and reach values close to those on May 16.
If the price breaks out of the triangle and completes the head and shoulders pattern, a breakdown should follow in order to complete it. As a result, the breakout would only be a short-term increase inside a longer downtrend.
Future Movement
One resistance area for BTC/USD is traced in the graph below. It is used to determine future areas of reversal.
If the Bitcoin price breaks out, the closest resistance area is found near $8400. It is likely to provide a reversal. Furthermore, this is a level that would complete the right shoulder of the pattern outlined above.
Summary
Bitcoin (BTC) is trading inside an ascending triangle. The RSI gives a bearish outlook in both the short and the long-term. The technical indicators support an increase toward the support line of the triangle.
Disclaimer: This article is not trading advice and should not be construed as such. Always consult a trained financial professional before investing in cryptocurrencies, as the market is particularly volatile.