About every four years, the amount of Bitcoin created in the mining of a block gets cut in half. This is referred to as a ‘Halving.’ Until now, there have been two such occasions, with the upcoming third estimated to occur around May 17, 2020. Since Bitcoin becomes scarcer after halving, its price has historically increased after to make up for the demand.
Well-known trader and financial analyst @Rektcapital recently pointed out interesting price movements before and after the two previous halvings.

The dates for the first two halvings and the projected date for the third are given in the table below.
There have been several similarities between the first and second halvings:
The First Halving
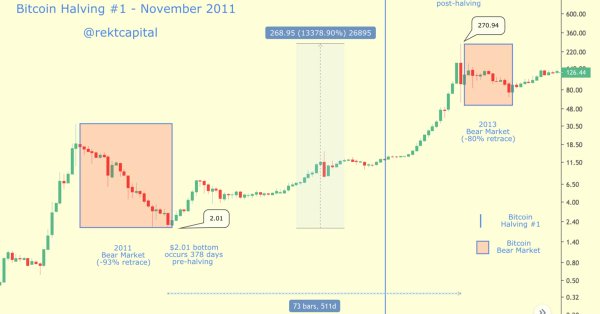
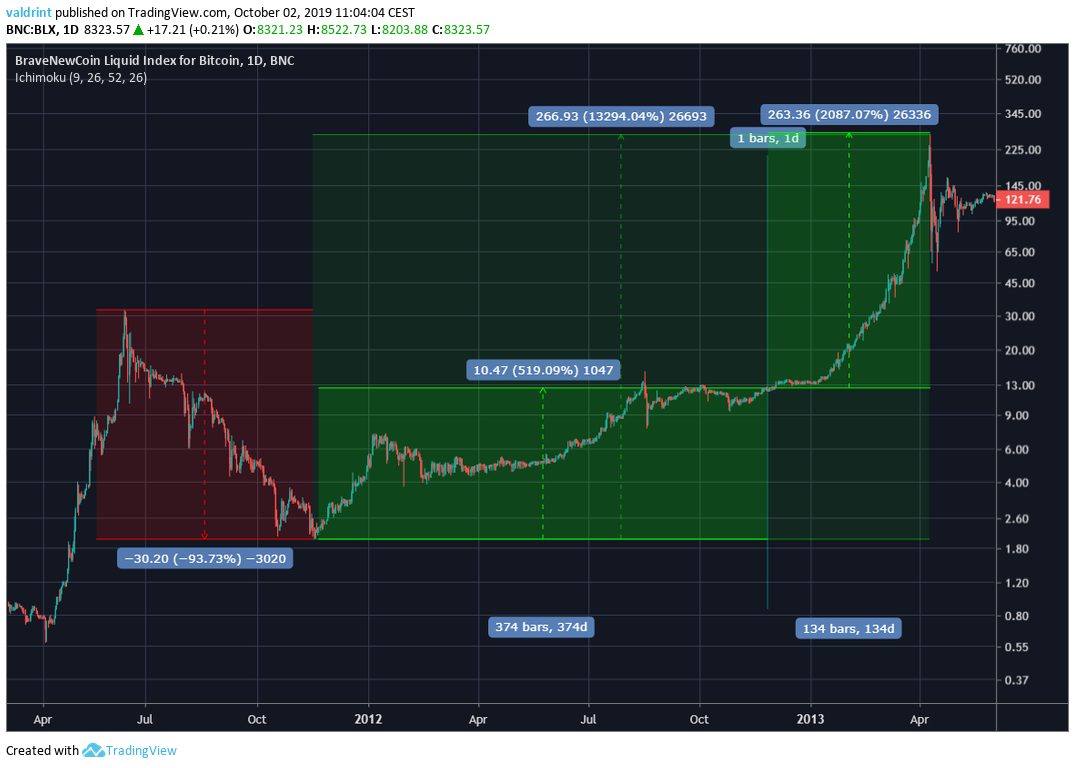
The first halving occurred on Nov 26, 2012. Prior to, Bitcoin’s price dropped by 93.73%, reaching a low of $2.01 on November 18, 2011.
An upward move ensued, lasting 508 days and culminated with a high of $268.67 on April 10, 2013. This amounts to an increase of 13,294%.

This increase can be divided into two segments — one moderate and one rapid.
The moderate increase occurred prior to halving. It lasted for 374 days, from a Nov 18, 2011 low to the Nov 26, 2012 halving. During this time, the price increased by 519%, amounting to a rate of increase of 1.38% per day.
The rapid move occurred after halving, It lasted for 134 days and the price increased by 2087%, giving a rate of increase of 15.57% per day.
Second Halving
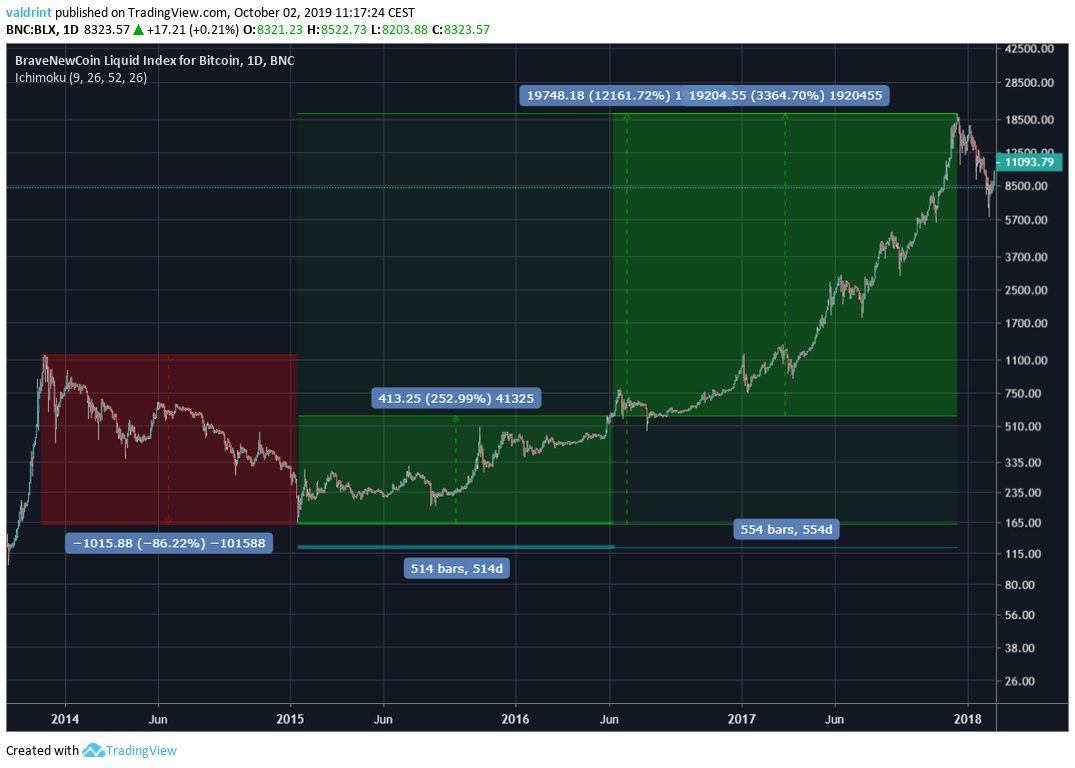
The second halving occurred on June 11, 2016. Prior to this, BTC decreased by 86.22%, reaching a low of $163.88 on Jan 14, 2015.
An upward move ensued, lasting 1068 days and culminating with a high of $19,764 on Dec 17, 2017. This amounted to a total increase of 12,161%.

Similar to the first halving, we can divide the upward move into two periods, one moderate and the other rapid.
The moderate move lasted for 514 days, from a Jan 14, 2015 low to the June 11, 2016 halving date. During this period the price increased by 253%, amounting to a rate of increase of 0.49% per day.
The rapid increase occurred after the halving and lasted 554 days. The price increased by 3364 %, amounting to a rate of increase of 6.07% per day.
Third Halving
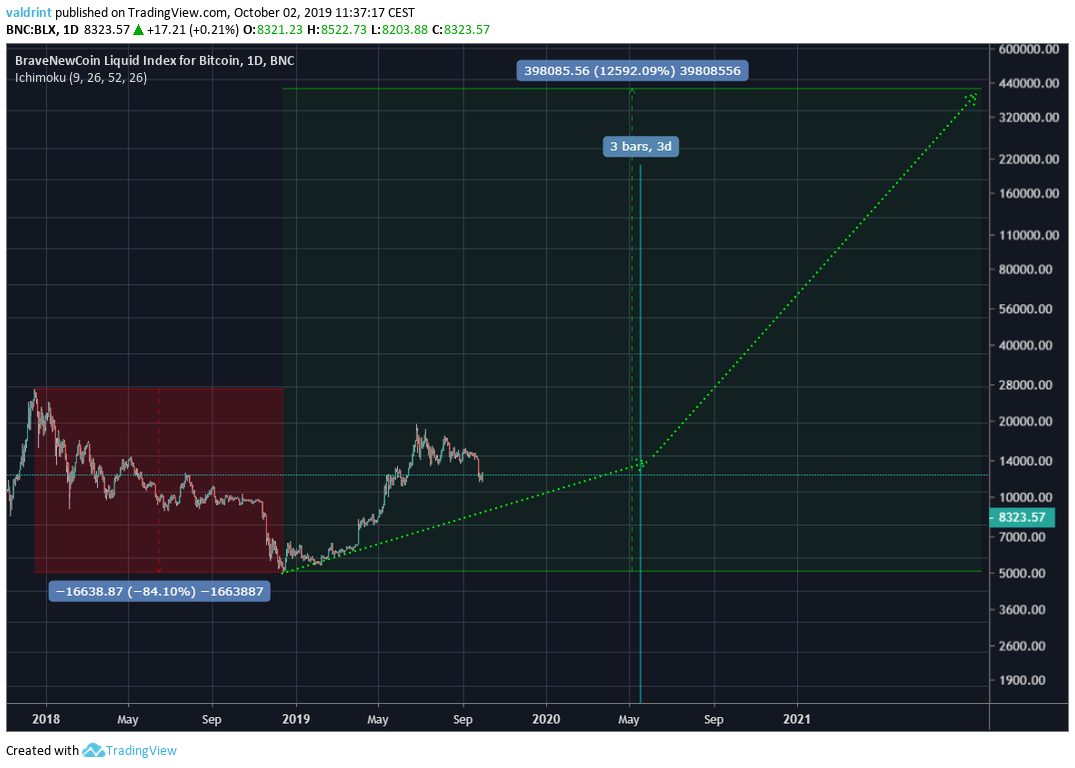
The third halving is projected to occur on May 17, 2020. The price decreased by 84.1% and reached a low of $3148.33 on Dec 15, 2018. Assuming an increase of 12,500% (Average of the increases of halvings 1 and 2), we get a price of nearly $400,000 as a new target high after the halving.

Since the movement before and after the first two halvings have not been identical, we cannot make a prediction on the exact price at the date of the third halving.
However, the trend of moderate-to-rapid growth before and after the previous halvings has been constant.
So, we can expect gradual growth until May 17, 2020, before the rate of increase accelerates. It may be possible to reach a high near $400,000 at the end of 2021 or the beginning of 2022.
