Bitcoin, Ethereum, and XRP have managed to stabilize after crashing hard over the weekend.
Key Takeaways
- Bitcoin lost the 50-day moving average as support for the first time in seven months.
- Ethereum is contained in a no-trade zone, with no clear signs for traders.
- XRP holders book profits, triggering a 44% correction.
The crypto market recently experienced one of its most severe flash crashes, generating over $9 billion in liquidations. Bitcoin has since fallen through a critical support level, but Ethereum and XRP might have a chance to recover.
Bitcoin Loses Crucial Support
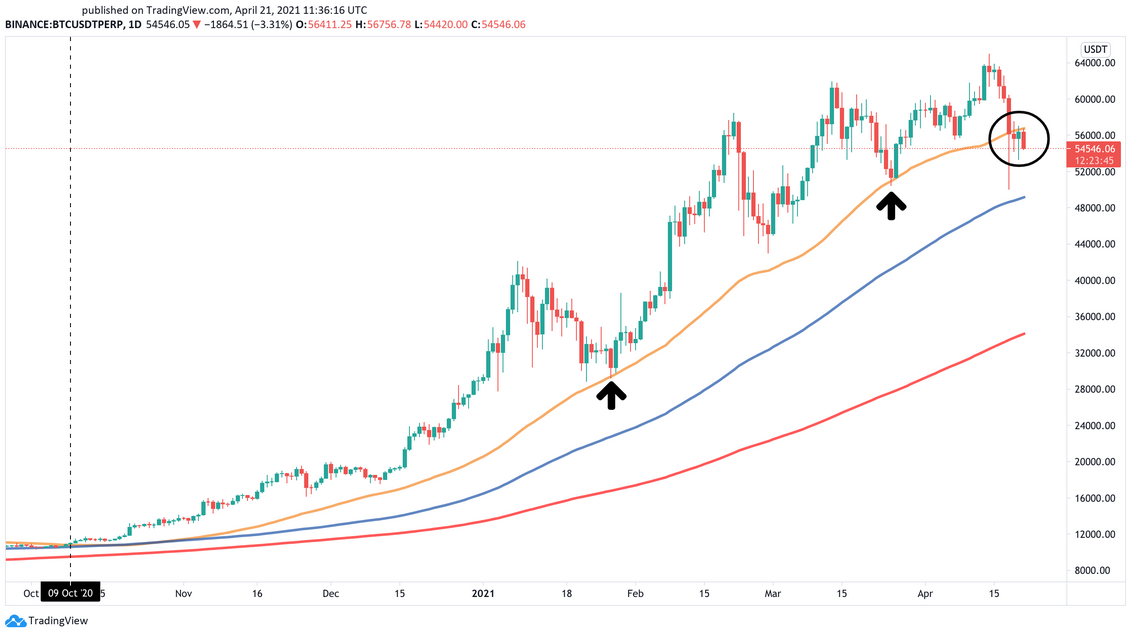
The 50-day moving average has played a vital role in Bitcoin’s price performance ever since it came into play on Oct. 9, 2020.
This trend-following indicator has held through some of the most significant retracements since then, serving as a rebound point that drove prices to record highs. However, such a crucial support level broke during the recent flash crash, signaling that a steeper correction is underway.
Bitcoin was forced to close below the 50-day moving average for the first time in seven months, which is a major point of concern even for some of the most prominent analysts in the industry.

Tone Vays, former VP at JPMorgan Chase, believes that the break of the 50-day moving average could lead to a “real disaster.” The technical analyst maintains that the “sell-off will accelerate” if Bitcoin trades below $54,500.
According to Vays, only a daily candlestick close above $59,000 might invalidate the bearish thesis and lead to further gains.
Even though some on-chain metrics suggest that a rebound is near, Vays seems to be right in the sense that the bull market cannot resume unless BTC regains the 50-day moving average as support. Until then, Bitcoin could drop further toward the 100- or 200-day moving average.
These potential “buy the dip” zones sit at $49,000 and $34,500, respectively.
Ethereum Holds Steady
Ethereum looks better than Bitcoin from a technical perspective.
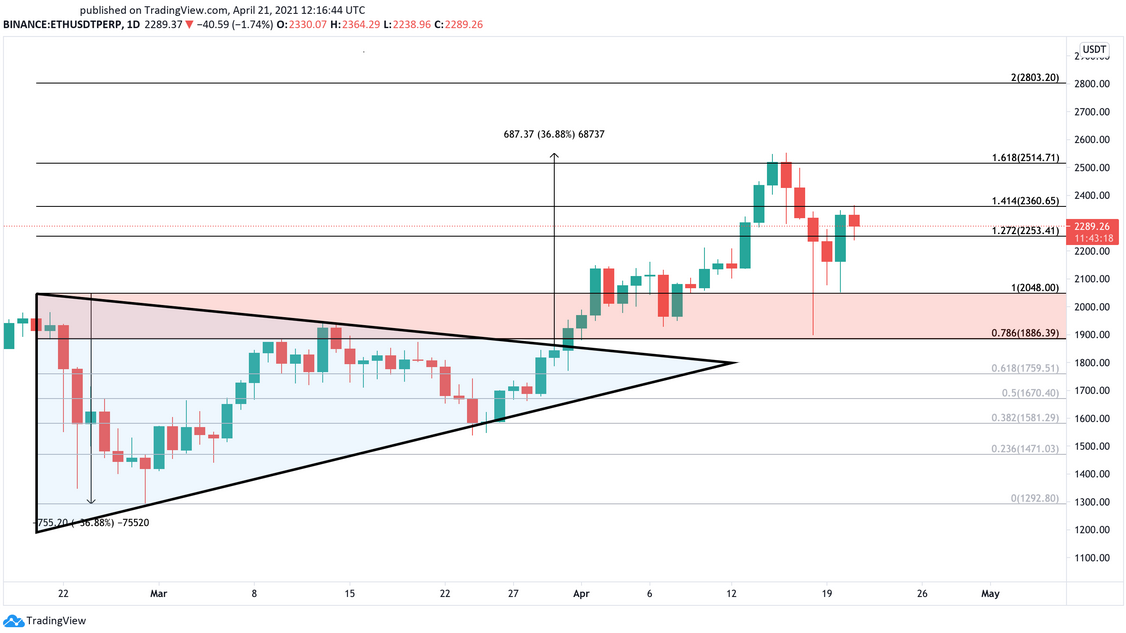
The second-largest cryptocurrency by market capitalization broke out of a symmetrical triangle on Mar. 31 and surged to meet the pattern’s target of $2,560. A spike in profit-taking was reasonable following the milestone, given the significance of the gains incurred.
The cryptocurrency market’s crash over the weekend saw Ether drop more than expected. Still, the demand area around $1,900 was able to contain prices from falling further, and now Ethereum appears to be trading within a no-trade zone.
A daily candlestick close below the 127.2% Fibonacci retracement level at $2,250 could lead to a retest of the $1,900 demand wall.
Conversely, a bullish impulse above the 141.4% Fibonacci retracement level at $2,360 might have the strength to push prices toward $2,500 or higher.

Despite the ambiguity, Skew recorded a significant spike in CME’s Ether futures volumes on Monday, Apr. 19. More than $360 million in trading volumes were registered on this day alone, representing the highest ever recorded since this derivative product launched.
Such market behavior suggests that institutional investors may have taken advantage of the downswing to buy ETH at a discount. Regardless, it is imperative to wait for a close above $2,360 before entering any bullish trades.
XRP Has Yet to Clear One Hurdle
XRP saw its market value skyrocket by a whopping 245% between Apr. 1 and 14. The fourth-largest cryptocurrency by market capitalization rose to a three-year high of $1.98, as it gained 1.41 points.
The sudden bullish impulse appears to have been fueled by speculation around the legal charges that Ripple is facing. Judge Sarah Netburn’s decision to deny the U.S. Securities and Exchange Commission access to the firm’s executives’ bank records was perceived as a win by the crypto community.
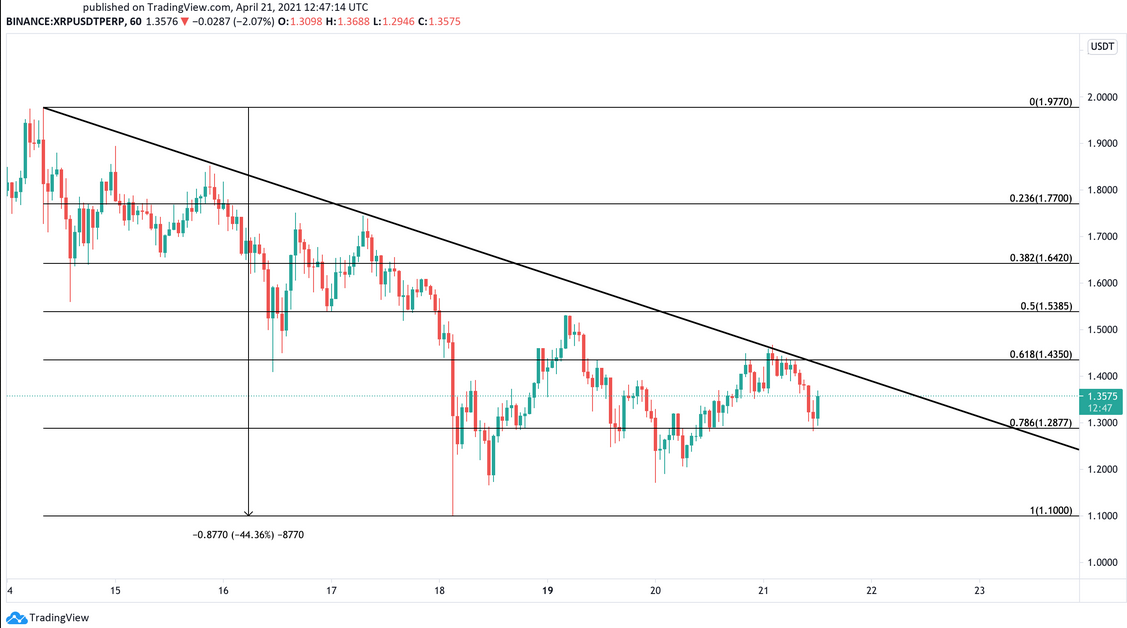
Still, an increase in selling pressure was imminent given the large number of XRP holders who have been underwatered since 2018. As this cryptocurrency approached $2.00, sell orders began to pile up, leading to a 44% correction to $1.10.

XRP has managed to recover some of the losses as it currently trades around $1.36. But it would have to slice through the 61.8% Fibonacci retracement level at $1.44 for the uptrend to resume. Turning this resistance barrier into support can serve as a sign that prices want to reach higher highs.
Nonetheless, a rejection from the overhead barrier could lead to a retest of the recent low at $1.10.
