Get 40% Off
🤯 Perficient is up a mind-blowing 53%. Our ProPicks AI saw the buying opportunity in March.Read full update

Bitcoin And Stock Prices, Both Symptoms Of Speculative Extremes

Published 01/18/2018, 06:01 AM
Updated 07/09/2023, 06:32 AM

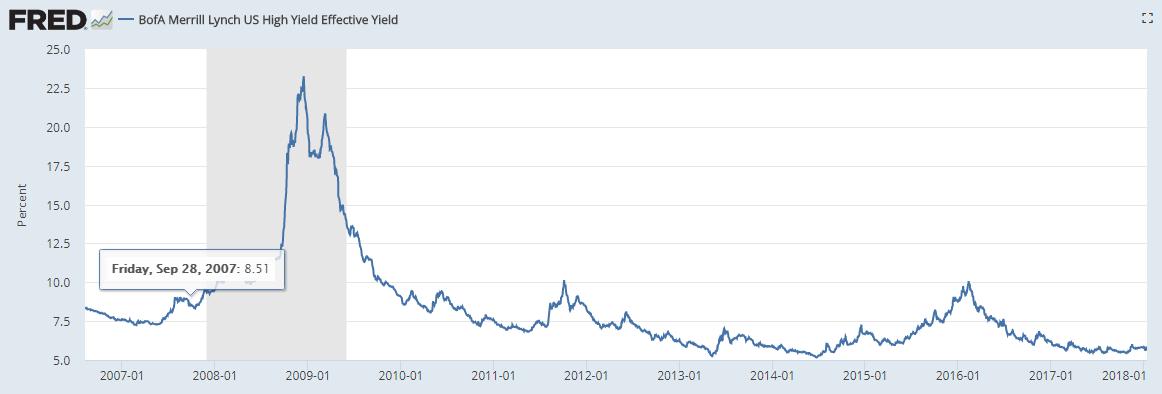
BofA Merrill Lynch US High Yield Effective Yield

The next domino to fall will be high yield credit, which has been sitting at or near all time lows lately. As for the stock market: last week saw another extreme in bullishness within the professional finance world.

-64.4% of investment advisors were bullish and just 13.5% bearish.


This is the largest divergence in over 30 years!


Maybe stocks will be the next domino to fall after all!

UPCOMING RISK EVENTS:
USD: Capacity Utilization Rate, Industrial Production m/m,
EUR: Final CPI y/y,
GBP: N/A.
JPY: N/A.

DOW JONES INDUSTRIALS

30 min
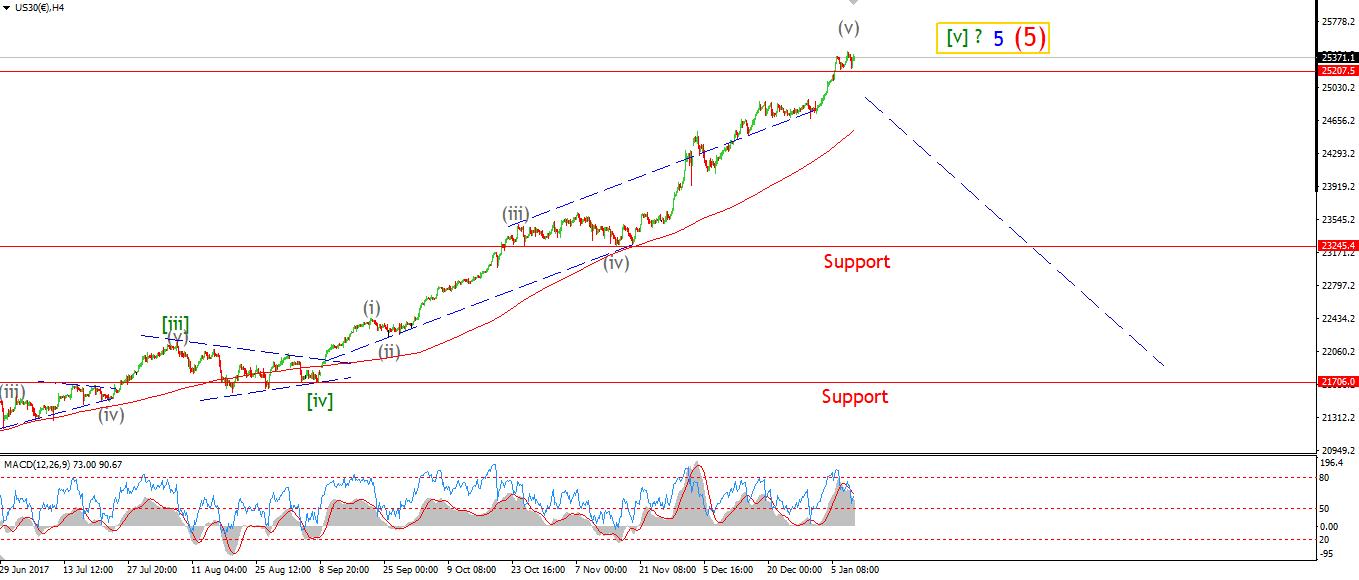
Dow Jones 30 Minute Chart4 Hours
Dow Jones 4 Hour ChartDaily
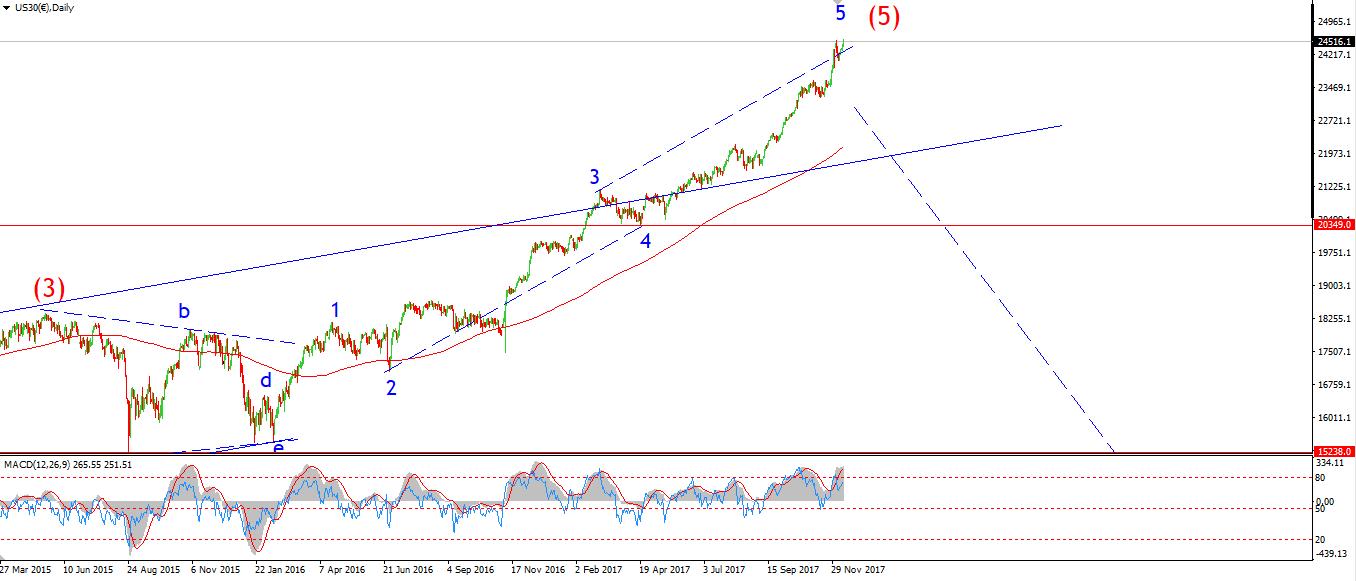
Dow Jones Daily Chart

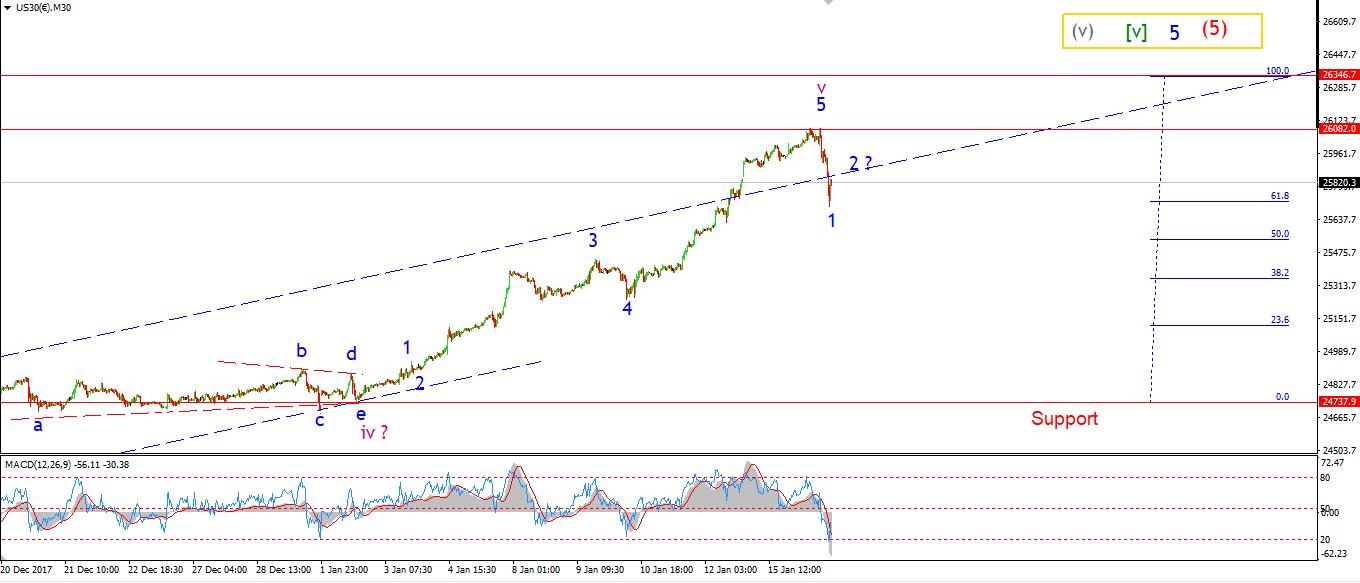
My Bias: market topping process completing

Wave Structure: Impulsive 5 wave structure, topping in an all time high.
Long term wave count: topping in wave (5)

The DOW has seen its first impulsive looking decline today after reaching another all time high at 26082. The price declined 300 points into the low of the session at 25708 a few moments ago. If the bear market is going to start here, this counts as a good start for sure. From here the key price action I am looking for is a clear five waves down off the high, followed by a clear three wave recovery to a lower high.


This must be visible on the hourly chart.


Certainly the extreme reading in investor bullishness fits well with today's sudden decline. Either way, this was overdue. For tomorrow; Lets concentrate on building a larger impulse wave to the downside from here, At that point we can get excited about the possibilities!

U.S CRUDE OIL30 min
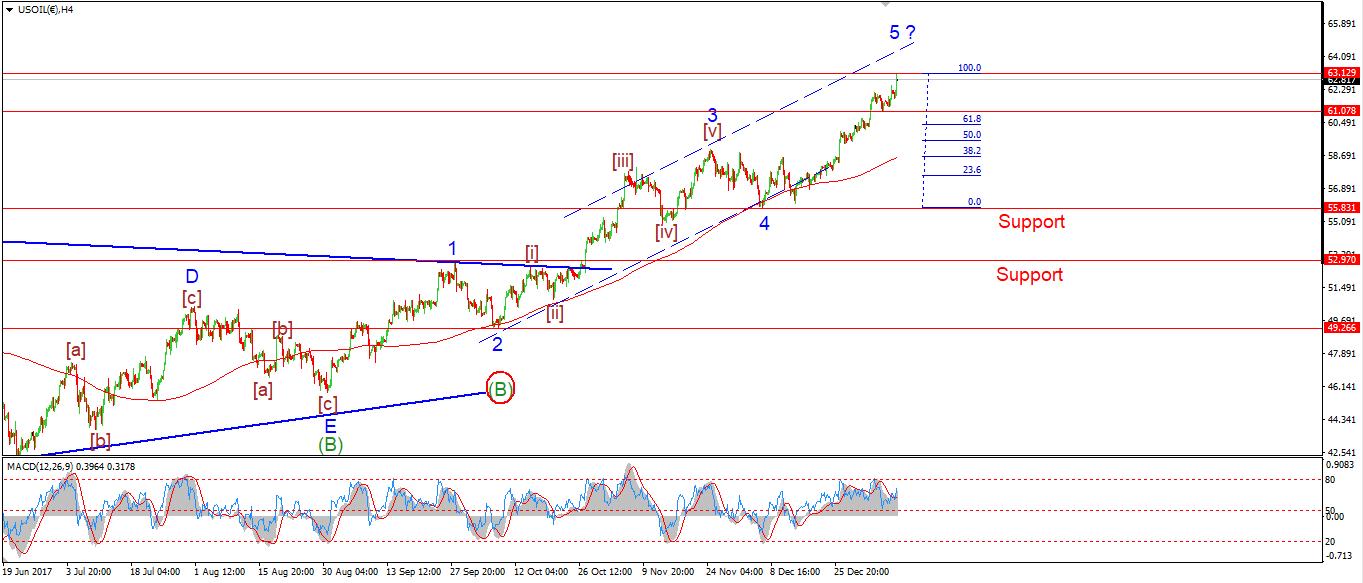
U.S CRUDE OIL 30 min4 Hours
Crude 4 Hour ChartDaily
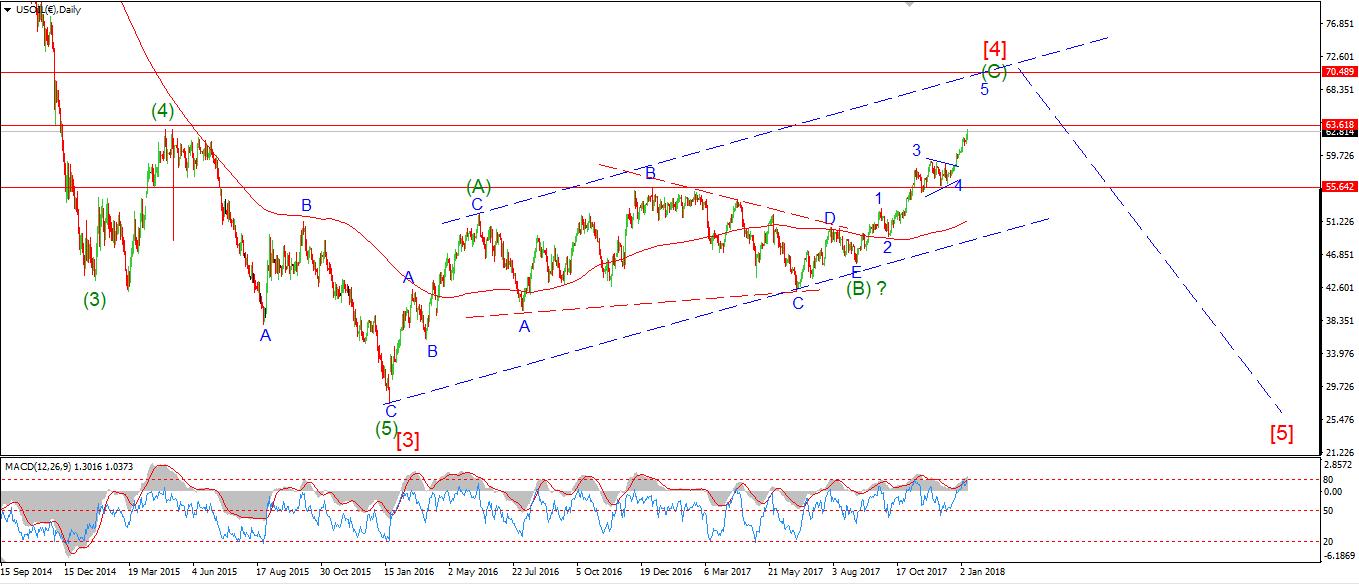
Crude Daily Chart

3rd party Ad. Not an offer or recommendation by Investing.com. See disclosure here or remove ads .

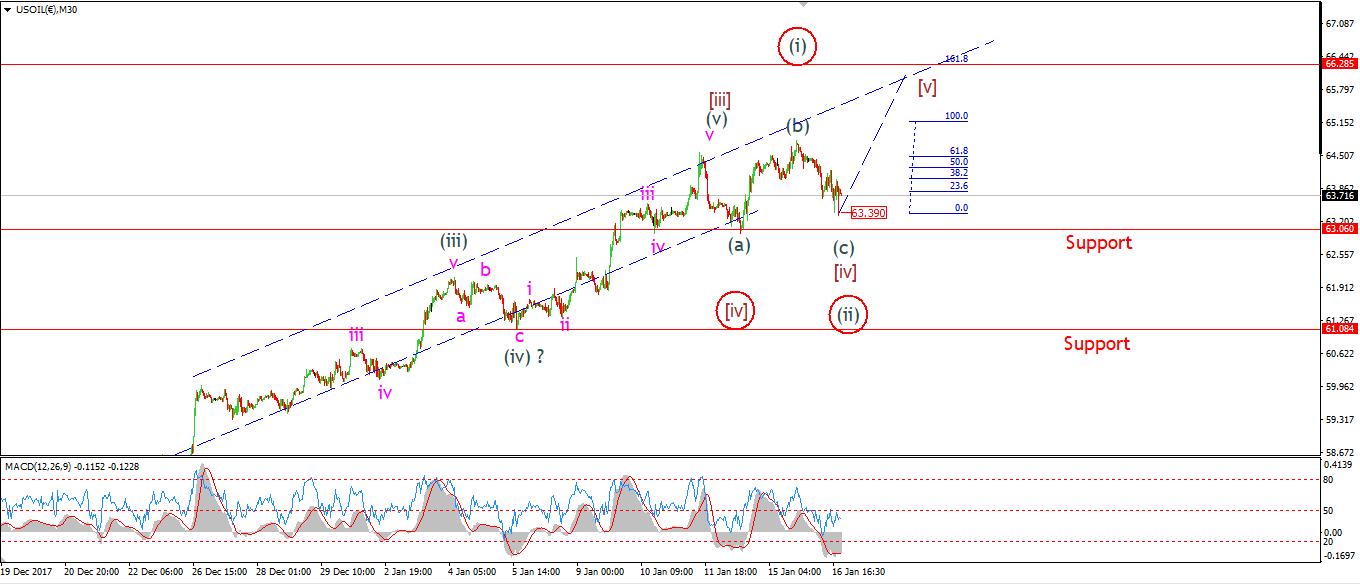
My Bias: topping in a large correction wave [4].
Wave Structure: Double combination higher in wave [4] red.
Long term wave count: wave [4] target $63 - $70

Crude corrected off the high as expected today, the decline has not cleared up which of the current wave counts is actually correct. Its a bit of a puzzle, but I will lay out the options. The current operating count views the correction as either a running flat, or an expanding flat.

The expanding flat idea requires a break of support at 63.06 to be valid. Also, the alternate count shows a now complete impulse wave at todays low.

Waves (i) and (ii) grey are complete and wave (iii) should follow into the $66 handle.


For tomorrow:
A further rally off todays low at 63.39 will favor the alternate wave count. A further higher low above that level will also point to the more bullish alternate count.

Latest comments

Risk Disclosure: Trading in financial instruments and/or cryptocurrencies involves high risks including the risk of losing some, or all, of your investment amount, and may not be suitable for all investors. Prices of cryptocurrencies are extremely volatile and may be affected by external factors such as financial, regulatory or political events. Trading on margin increases the financial risks.
Before deciding to trade in financial instrument or cryptocurrencies you should be fully informed of the risks and costs associated with trading the financial markets, carefully consider your investment objectives, level of experience, and risk appetite, and seek professional advice where needed.
Fusion Media would like to remind you that the data contained in this website is not necessarily real-time nor accurate. The data and prices on the website are not necessarily provided by any market or exchange, but may be provided by market makers, and so prices may not be accurate and may differ from the actual price at any given market, meaning prices are indicative and not appropriate for trading purposes. Fusion Media and any provider of the data contained in this website will not accept liability for any loss or damage as a result of your trading, or your reliance on the information contained within this website.
It is prohibited to use, store, reproduce, display, modify, transmit or distribute the data contained in this website without the explicit prior written permission of Fusion Media and/or the data provider. All intellectual property rights are reserved by the providers and/or the exchange providing the data contained in this website.
Fusion Media may be compensated by the advertisers that appear on the website, based on your interaction with the advertisements or advertisers.
© 2007-2024 - Fusion Media Limited. All Rights Reserved.