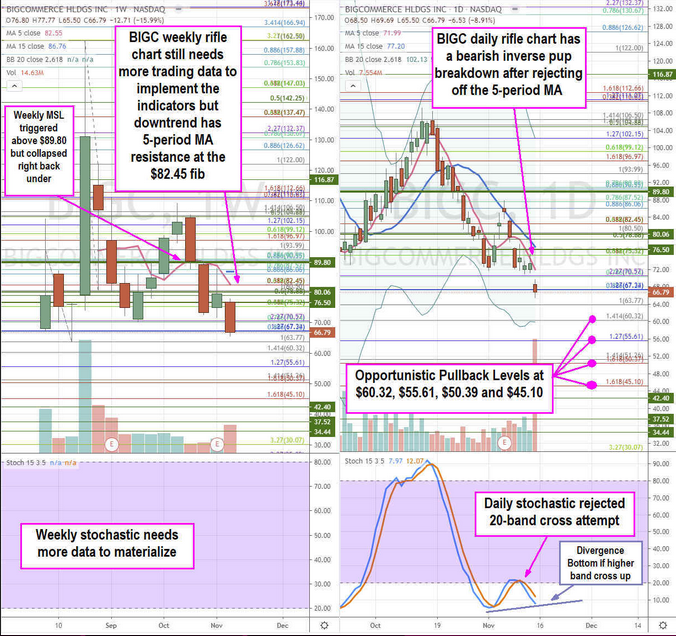
Ecommerce facilitator Bigcommerce (NASDAQ:BIGC) stock has been frustrating investors since peaking at $162.50 on Aug. 26, 2020. Shares have sold off on every breakout attempt as it trades back towards post-IPO lows and outperforming the benchmark S&P 500 index. As we get closer to a COVID-19 vaccine approval, pandemic benefactors are being sold-off as money rotates back into value stocks. Ecommerce winners are seeing the same rotation as peers Shopify (NYSE:SHOP) and Wix.Com (NASDAQ:WIX) experience heavy selling pressure. However, the selling on BigCommerce is reaching excessively bearish levels despite the recent earnings blow-out. This divergence can provide risk-tolerant investors the chance to get exposure at opportunistic pullback levels.
Q3 FY 2020 Earnings Release
On Nov. 5, 2020, BigCommerce released its fiscal third-quarter 2020 results for the quarter ending September 2020. The Company reported an adjusted earnings-per-share (EPS) loss of (-$0.28), beating estimates by $0.12. Revenues grew by 40.6% year-over-year (YOY) to $39.74 million versus analyst estimates of $36.34 million. Subscription revenue comprised 67% and service revenues were up 82% YoY and accounted for 33% of total Q3 sales.
The pandemic has resulted in, “a shortening of sales cycle times, and an improvement in lead conversion and competitive win rates.”, according to BigCommerce CFO, Robert Alvarez. The Q3 annual run rate (ARR) was $167 million, up 38% YoY. The Company raised Q4 revenues to a range of $38.3 million to $38.7 million versus $37.45 million analyst estimates.
Conference Call Takeaways
BigCommerce CEO, Brent Bellm, provided more color on the quarter providing examples of clients utilizing the platform to launch ecommerce debuts including Chapstick, Nikon Canada, Chivas football club in Mexico, Baseball Hall of Fame and Little League International. The Company launched Channel Manager feature for ecommerce clients to manage a comprehensive omnichannel sales presence. The Company formed a partnership with the Wish ecommerce marketplace, which, “expands BigCommerce merchants’ visibility to 100 million monthly active users across more than 100 countries.” BigCommerce also signed new partnerships with SureDone, Feedonomics and Deliverr to boost merchant’s ability to sell cross channel. Enterprise accounts grew 48% YoY. The Quarter was also one of the strongest quarters for acquisition of new B2B and B2C merchants. International revenues rose 53% YoY, 67% YoY in EMEA and 42% in APAC. The guidance raise was directly related to an increase in revenue shares from its largest ad partner but expects positive renegotiation in Q4. The key driver for partner revenues is the actual sales volume or GMV which the Company continues to see YoY growth.
Citigroup Sell Rating
Shares of BigCommerce ran up to as high as $87.88 into the Q3 earnings release and triggered a sell-the-news reaction afterwards. As shares tried to stabilize near $72, they got slammed again. On Nov. 13, 2020, Citigroup initiated coverage on BigCommerce stock with a Sell rating and $65 target. The continued competition and return to value as COVID-19 vaccine approvals near has caused ecommerce stocks to lose steam quickly. BigCommerce shares have been punished excessively creating opportunistic pullbacks for nimble traders and risk-tolerant investors.

BIGC Opportunistic Pullback Levels
Using the rifle charts on the weekly and daily time frames provides a precise view of the landscape for BIGC stock. Since BIGC is a recent IPO, the weekly rifle chart hasn’t completely materialized with all indicators yet. However, it has produced a weekly 5-period moving average (MA) resistance at the $82.45 Fibonacci (fib) level. The daily rifle chart formed a market structure low (MSL) buy trigger above $80.06 and $76.50, which both triggered briefly only to fail and collapse again.
The daily rifle chart has a bearish inverse pup breakdown as the stochastic rejected the 20-band cross attempt. This adds further selling pressure towards the daily lower Bollinger Bands (BBs) and potentially further opportunistic pullback levels at the $60.32 fib, $55.61 fib, $50.39 fib and the $45.10 fib.
While these price levels seem a bit extreme, BIGC is a momentum stock with thin liquidity that moves with the high flying ecommerce marketplaces and facilitators like SHOP, WIX and Etsy (NASDAQ:ETSY). It’s prudent o monitor BIGC with these stocks together to gauge the price action and sentiment for the segment.
