
Summary: S&P profits are up 22% yoy. Sales are 7.2% higher. By some measures, profit margins are at new highs. This is in stark contrast from a year ago, when profits had declined by 15% and most investors expected a recession and a new bear market to be underway.
Bearish pundits continue to repeat claims that are more than 20 years old: that "operating earnings" are deviating more than usual from GAAP measurements, and that share reductions (buybacks) are behind most EPS growth. These are both wrong. Continued growth in employment, wages and consumption tell us that corporate financial results should be improving, as they have in fact done.
Where critics have a valid point is valuation: even excluding energy, the S&P is now more highly valued than anytime outside of the 1998-2000 dot com bubble. With economic growth of 4-5% (nominal), it will likely take excessive bullishness among investors to propel S&P price appreciation at a significantly faster rate.
A little over 60% of the companies in the S&P 500 have released their 1Q17 financial reports. The headline numbers are good. Overall sales are 7.2% higher than a year ago, the best annual rate of growth in more than 6 years. Earnings (GAAP-basis) are 22% higher than a year ago. Profit margins are back to their highs of nearly 10% first reached in 2014.
Before looking at the details of the current reports, it's worth addressing some common misconceptions regularly cited by bearish pundits.
First, are earnings reports meaningfully manipulated? This concern has been echoed by none other than the chief accountant of the SEC, who has complained about non-GAAP earnings numbers being "EBS", or "everything but bad stuff."

Here's the catch: this quote is not new, it was made nearly 20 years ago as the 1990's bull market was ending. A version of the complaint that financial reports are fake has been a feature of every bull market.
Now, it's true that "operating earnings" (blue line) both overstate and smooth profits compared to earnings based on GAAP (red line). But that has been the case over the past several decades; more importantly, the trend in earnings is clearly the same regardless of methodology (all financial data in this post is from S&P).

In fact, the difference between operating and GAAP earnings in 1Q17 was about 10%, which is normal (i.e., it equals the 25-year median). Operating earnings overstated profits by much more in the 1990s and earlier in the current bull market. The biggest differences have always been during bear markets. In short, recent deviations from GAAP are unremarkable when compared to history.

Second, companies have been accused of juicing their financial reports through corporate buybacks; in reality, however, almost 90% of the growth in earnings in the S&P over the past 7 years has come from better profits, not a reduction in shares. Better profits drive growth, not "financial engineering."

A basic sanity check on financial reports is to ask whether they are largely congruent with recent economic data. The answer at this point is that they are.
Jobless claims, for example, are at more than a 40 year low, and the trend down has not abated as it normally does ahead of a recession (first chart below). More people working drives consumption higher. US demand growth, measured any number of different ways, has been about 4-5% nominal YoY during the past two years (second chart below). There has been no marked deterioration in domestic consumption. Under these conditions, continued growth in corporate sales should be expected.


When corporate sales and profits dropped by double digits between mid-2014 and early-2016, many believed it signaled an imminent recession. We wrote about this a year ago, saying that view was likely to be wrong (that post is here). Events since then bear this analysis out (as summarized here).
Let's turn to the latest corporate reports.
Overall sales are 7.2% higher than a year ago. This is the best sales growth since 4Q11 - more than 6 years ago. Over the past 2 years, sales growth has averaged almost 4% per annum. On a trailing 12-month basis (TTM), sales are 3.8% higher YoY.

Two dates are called out on the chart above and those that follow. Recall that oil prices peaked at the end of 2Q14 and then fell 70% before bottoming in 1Q16. Oil prices have since jumped by over 50%. The affect on overall S&P sales is apparent in the chart above.
Since the oil peak in 2Q14, energy sector sales have declined 40%; despite this, overall S&P sales are now slightly higher (far right column). Importantly, nearly all the other sectors have continued to grow. In the past year, the sectors with the highest weighting in the S&P have grown an average of 5% (box in middle column).

Excluding the volatile energy sector, sales for the remainder of the S&P have continued to trend higher at about the same rate over the past 6 years (blue line; from Yardeni). 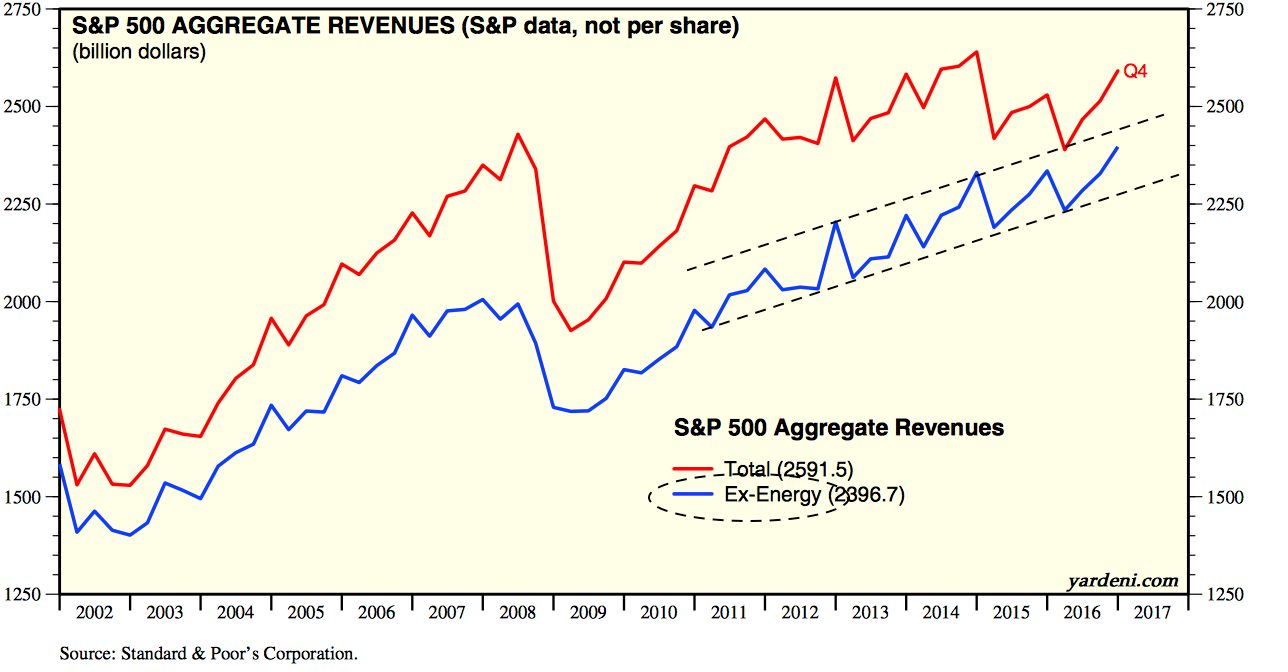
Some of the volatility in ex-energy sales is due to significant changes in the value of the US dollar over the past 3 years. Companies in the S&P derive about half of their sales from outside of the US. When the dollar rises in value, the value of sales earned abroad (in foreign currency) falls. If foreign sales grow 5% but the dollar gains 5% against other currencies, then sales growth will be zero in dollar terms.
The trade-weighted dollar appreciated by a massive 25% between 3Q14 and 2Q15. The dollar's appreciation alone cut S&P sales by more than 10 percentage points. As an example, the chart below compares changes in the dollar (blue line; inverted) with growth in S&P sales (red line). A higher dollar corresponds with lower sales (from Yardeni).

Importantly, the dollar has since stabilized. In the past year (to 1Q17), the dollar has appreciated by just 2%. For the current quarter (2Q17), appreciation is on track for about 3%.
Overall EPS (GAAP-basis) is 22% higher than a year ago. On a trailing 12-month basis (TTM), EPS is 15% higher YoY. Again, note the impact of oil prices on earnings: EPS peaked with high oil prices in 2Q14 and then bottomed near the low in oil prices at the end of 2015.

Likewise, profit margins peaked at 10.1% in 2Q14, fell to 8% at the end of 2015 and have since rebounded nearly back to their highs in 1Q17 (9.9%).

For most sectors, margins remained stable between 2Q14 and today (red line). The big outlier was energy (blue line). Excluding energy, margins for the rest of the S&P have improved slightly since 2Q14, from 10.4% to 10.5%. Margins for non-energy sectors are now at a new high.

Looking ahead, it is reasonable to assume that corporate (non-energy) sales growth will be largely similar to the nominal economic growth rate of 4-5% (numbers below are real; from Bloomberg).

The dollar has stabilized, with YoY appreciation tracking just 3% for 2Q17. Currency effects are minor under these conditions (second chart from JPM).


The energy sector remains the biggest wildcard for future sales and EPS growth. At present, energy should continue to be a tailwind to sales and EPS growth: the YoY change in oil is tracking about a 20% gain. But the overall dollar level of energy EPS is still less than half of its prior level (second chart from JPM).


Oil has fallen about 20% in just the past month. As we have seen, the negative impact of lower oil prices on the energy sector is far more significant than any positive affect on other sectors. As an example of minimal affect of lower prices on the rest of the S&P, consider this: the price of oil fell from over $100 to under $50 between mid-2013 and mid-2016 but non-energy sector operating margins were 10% in both instances.
Where bearish pundits have a valid point is valuation. Even excluding the troubled energy sector, valuations were rich at the end of 2014 and are even more so today. These valuations are higher than in mid-2007 when the prior bull market ended (from Yardeni).

With economic growth of 4-5% (nominal), it will likely take excessive bullishness among investors to propel S&P price appreciation at a significantly faster annual clip. Why? When investors become bullish (blue line), valuations rise (red line). Investors had been pessimistic a year ago; they are now optimistic once again. If oil prices and the dollar stabilize, earnings growth may be only 5% yoy but valuations could still push the equity market higher (from Yardeni).

Importantly, valuations have almost no bearing on the market's 1-year forward return (left side). But over the longer term, current valuations suggest that single digit annual returns are odds-on (right side; from JP Morgan).
