The mid-cap value style ranks eleventh out of the twelve fund styles as detailed in my style roadmap. It gets my Dangerous rating, which is based on an aggregation of the ratings of 12 ETFs and 206 mutual funds in the mid-cap value style as of July 19, 2012.
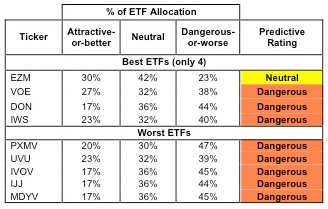
Figure 1 ranks from best to worst the nine mid-cap value ETFs that meet our liquidity standards and Figure 2 shows the five best- and worst-rated mid-cap value mutual funds. Not all mid-cap value style ETFs and mutual funds are created the same. The number of holdings varies widely (from 21 to 617), which creates drastically different investment implications and ratings. The best ETFs and mutual funds allocate more value to Attractive-or-better-rated stocks than the worst, which allocate too much value to Neutral-or-worse-rated stocks.
To identify the best and avoid the worst ETFs and mutual funds within the mid-cap value style, investors need a predictive rating based on (1) stocks ratings of the holdings and (2) the all-in expenses of each ETF and mutual fund. Investors need not rely on backward-looking ratings.
Investors should not buy any mid-cap value ETFs or mutual funds because none get an Attractive-or-better rating. If you must have exposure to this style, you should buy a basket of Attractive-or-better rated stocks and avoid paying undeserved fund fees. Active management has a long history of not paying off.
Figure 1: ETFs with the Best & Worst Ratings – Top 5 (where available)
* Best ETFs exclude ETFs with less NAV’s less than 100 million.
Sources: New Constructs, LLC and company filings
First Trust Mid Cap Value AlphaDEX Fund (FNK) and iShares Morningstar Mid Value Index Fund (JKI) are excluded from Figure 1 because their total net assets (TNA) are below $100 million and do not meet our liquidity standards.
Figure 2: Mutual Funds with the Best & Worst Ratings – Top 5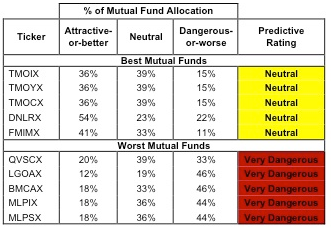
* Best mutual funds exclude funds with NAV’s less than 100 million.
Sources: New Constructs, LLC and company filings
Seven mutual funds are excluded from Figure 2 because their total net assets (TNA) are below $100 million and do not meet our liquidity standards.
WisdomTree MidCap Earnings Fund (EZM) is my top-rated mid-cap value ETF and Touchstone Strategic Trust: Touchstone Mid Cap Value Opportunities Fund (TMOIX) is my top-rated mid-cap value mutual fund. Both earn my Neutral rating.
SPDR S&P 400 Mid Cap Value ETF (MDYV) is my worst-rated mid-cap value ETF and ProFunds: Mid-Cap Value ProFund (MLPSX) is my worst-rated mid-cap value mutual fund. MDYV earns my Dangerous rating and MLPSX earns my Very Dangerous rating.
Figure 3 shows that 360 out of the 1429 stocks (over 23% of the total net assets) held by mid-cap value ETFs and mutual funds earn an Attractive-or-better rating. However, there are not any mid-cap value ETFs or mutual funds that earn an Attractive-or-better rating.
The takeaways are: mutual fund managers allocate too much capital to poor quality stocks and mid-cap value ETFs offer exposure to poor quality stocks.
Figure 3: Mid-cap Value Style Landscape For ETFs, Mutual Funds & Stocks 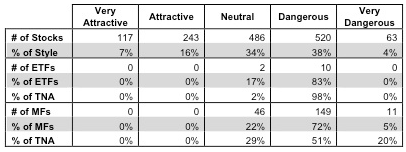
Sources: New Constructs, LLC and company filings
As detailed in “Cheap Funds Dupe Investors”, the fund industry offers many cheap funds but very few funds with high-quality stocks, or with what I call good portfolio management.
Investors need to tread carefully when considering mid-cap value ETFs and mutual funds, because 83% of ETFs are rated Dangerous and 77% of mutual funds are rated Dangerous-or-worse. No mid-cap value ETFs or mutual funds earn an Attractive-or-better rating. Investors desiring exposure to the mid-cap value category should buy a basket of Attractive-or-better-rated mid-cap value stocks.
TRW Automotive Holdings (TRW) is one of my favorite stocks held by mid-cap value ETFs and mutual funds and earns my Attractive rating. Sometimes when a company institutes a restructuring plan, it’s a dying gasp and a desperate move to squeeze out a few more years of life. TRW Automotive, however, is a great example of a company that has been able to benefit dramatically from restructuring. The financial crisis and recession were hard on the auto industry, but TRW took advantage of the downtown by tightening their belts and improving their operating efficiency. They emerged from the recession stronger than ever.
Over the past two years, pre-tax operating margins were about double the margins of the two prior years, up to 8.5% in 2010 and 7.7% in 2011 (up from 3.4% and 3.7% in 2008 and 2009). Keep in mind that our calculation of pre-tax operating income (NOPBT) excludes the 2008 and 2009 restructuring charges. So those numbers do not reflect merely the absence of restructuring charges, they are genuine improvements. With revenues up to pre-crisis levels and growing, TRW turned in their most profitable years on record in 2010 and 2011. Before restructuring, TRW never earned an ROIC higher than 6% and were eroding away shareholder value. After restructuring, however, they turned in 13.8% ROIC in 2010 and 13.7% in 2011. This is a company that has dramatically improved the profitability of its business and TRW’s focus on long-term value-creation is paying off. Best of all, the market is pricing TRW as if its after-tax profits (NOPAT) are going to permanently decline by 37%. Sometimes Mr. Market can irrationally hold a grudge, but when he does, it can create an attractive opportunity for investors who do the proper due diligence.
Lamar Advertising (LAMR) is one of my least favorite stocks held by mid-cap value ETFs and mutual funds and earns my Dangerous rating. At first glance, Lamar Advertising does not seem like an awful company. Their revenues and NOPAT have been steady over the last decade and their NOPBT margins have been hovering around 20% for several years. However, LAMR has consistently failed to generate positive economic earnings. Lamar’s ROIC has never reached above 3.5% since 1998 when my model begins. Companies that earn ROIC
Figures 4 and 5 show the rating landscape of all mid-cap value ETFs and mutual funds.
Figure 4: Separating the Best ETFs From the Worst Funds 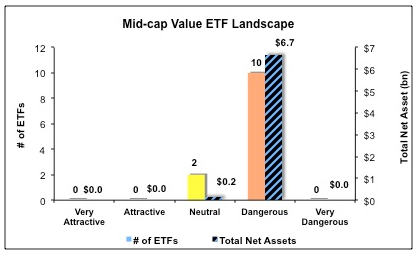
Sources: New Constructs, LLC and company filings
Figure 5: Separating the Best Mutual Funds From the Worst Funds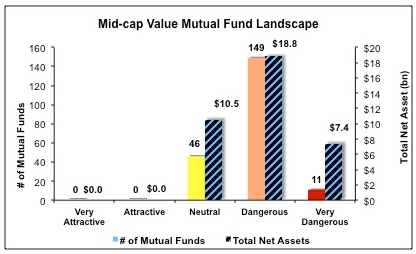
Sources: New Constructs, LLC and company filings
Disclosure: I receive no compensation to write about any specific stock, sector, style or theme.
- English (UK)
- English (India)
- English (Canada)
- English (Australia)
- English (South Africa)
- English (Philippines)
- English (Nigeria)
- Deutsch
- Español (España)
- Español (México)
- Français
- Italiano
- Nederlands
- Português (Portugal)
- Polski
- Português (Brasil)
- Русский
- Türkçe
- العربية
- Ελληνικά
- Svenska
- Suomi
- עברית
- 日本語
- 한국어
- 简体中文
- 繁體中文
- Bahasa Indonesia
- Bahasa Melayu
- ไทย
- Tiếng Việt
- हिंदी
Best And Worst ETFs (And Mutual Funds): Mid-Cap Value
Published 07/23/2012, 02:30 AM
Updated 07/09/2023, 06:31 AM
Best And Worst ETFs (And Mutual Funds): Mid-Cap Value
3rd party Ad. Not an offer or recommendation by Investing.com. See disclosure here or
remove ads
.
Latest comments
Install Our App
Risk Disclosure: Trading in financial instruments and/or cryptocurrencies involves high risks including the risk of losing some, or all, of your investment amount, and may not be suitable for all investors. Prices of cryptocurrencies are extremely volatile and may be affected by external factors such as financial, regulatory or political events. Trading on margin increases the financial risks.
Before deciding to trade in financial instrument or cryptocurrencies you should be fully informed of the risks and costs associated with trading the financial markets, carefully consider your investment objectives, level of experience, and risk appetite, and seek professional advice where needed.
Fusion Media would like to remind you that the data contained in this website is not necessarily real-time nor accurate. The data and prices on the website are not necessarily provided by any market or exchange, but may be provided by market makers, and so prices may not be accurate and may differ from the actual price at any given market, meaning prices are indicative and not appropriate for trading purposes. Fusion Media and any provider of the data contained in this website will not accept liability for any loss or damage as a result of your trading, or your reliance on the information contained within this website.
It is prohibited to use, store, reproduce, display, modify, transmit or distribute the data contained in this website without the explicit prior written permission of Fusion Media and/or the data provider. All intellectual property rights are reserved by the providers and/or the exchange providing the data contained in this website.
Fusion Media may be compensated by the advertisers that appear on the website, based on your interaction with the advertisements or advertisers.
© 2007-2024 - Fusion Media Limited. All Rights Reserved.
