Get 40% Off
🤯 Perficient is up a mind-blowing 53%. Our ProPicks AI saw the buying opportunity in March.Read full update

Bears In Charge Of S&P 500. What’s Next?

Published 09/14/2022, 09:32 AM
Updated 07/09/2023, 06:31 AM

In my last update (see here), I showed that the S&P 500’s immediate bullish upside path had been denied and, with that, two primary possibilities were forming:

  1. Rallying the index above last week’s low (SPX 4120) will lock in an a-b-c pattern, as already shared in early August (see here). Then we should expect [a] c-wave to ideally around SPX 4550.
  2. The current price action is a (rare) expanding leading diagonal. It means the SPX should now be in (grey) minute wave-iv, followed by wave-v to complete (green) minor wave-1. Minor waves 2, 3, 4, and 5 should follow, as shown in Figure 1 below.

I concluded by stating:

“If the bulls can push the SPX back above $4120 …, then EWP option [1] is operable. If they cannot, and the bears manage an impulse lower from the August high, the[n] path [in option] 2 becomes preferred.”

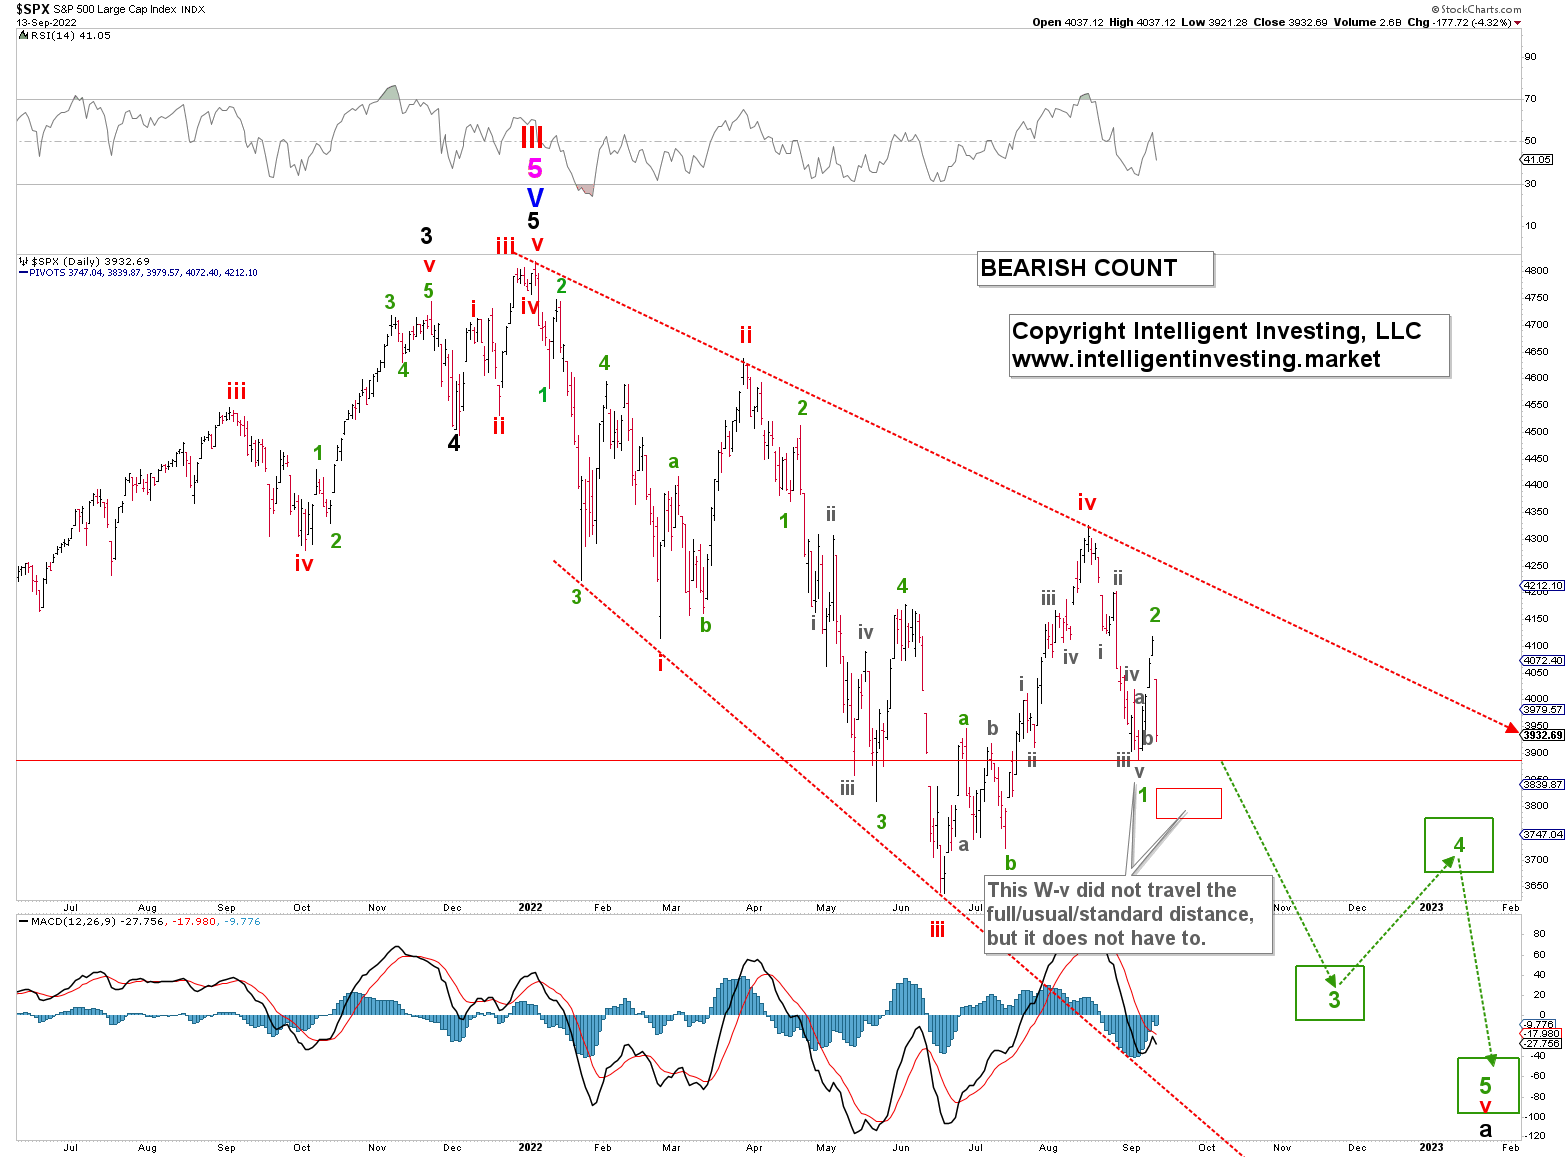
Figure 1. S&P 500 daily chart with detailed EWP count and several technical indicators

The index topped that same day right inside the ideal (grey) W-iv target zone (SPX 4105+/-15) at SPX4018 and dropped the next trading day to SPX 3887, which was a bit short of the ideal SPX 3800+/-50 target zone for the (grey) W-v.

Nothing says markets must always follow perfect, standard Fibonacci-based Elliott Wave Principle (EWP) patterns. Besides, once the (grey) W-v would complete (green) W-1, I was looking for a bounce back to around SPX4050 for green W-2, followed by a sharp W-3 to the downside.

3rd party Ad. Not an offer or recommendation by Investing.com. See disclosure here or remove ads .

Yesterday, the index took a horrible sharp turn lower. Thus, it appears most likely that option 2, as now shown in more detail in figure 1 above, is in play.

A break below the early September low of SPX3886 then opens the door for the impulse pattern as shown with an ideal target zone of SPX 3515-3400 for (green) W-3/c, then a potential W-4 rally back to ideally SPX3675-3785 followed by the last drop to ideally SPX 3230-3330 to complete W-v od W-c of W-A.

There’s a slight nuance to this overall bigger picture W-A, but the anticipated path and downside targets are the same. Hence, I will share it once we get there.

Latest comments

Dr. Arnout,  The graph you presented for the Nasdaq was really good! I could clearly see when the next rally was going to happen. It was very helpful. On this one however, I find difficult to see if there will be a rally at all in October or in the near future, when I look at this graph it gives me the impression that everything will be downside up to December, is this right? so nothing interesting will happen in between? after this rally in December, there will be more downside starting 2023?
Thank you! Please know, I don't present anything accurately in time. I simply work with the space available to keep the charts still relevant, understandable, and legible.
Hey, you have started getting your wave count right again. Your final target zone is perfect, except I suppose it should not breach 3234 (W-2 low).
This guy makes sense. just leave him alone to write what he wants. Finding out what will happen next is so easy
so basically if the market does not go up it goes down. brilliant
ABSOLUTELY YOU ARE CORRECT W.R.T TECHNICALS.
He tells you what he sees in the shapes of clouds in the sky. Wait ...now it looks like a bunny.
He tells you what he sees in the shapes of clouds in the sky. Wait now it looks like a bunny.
amazing analysis!
The laughing stock of investing.com
Dr Schure is back in the office. And this time finally the doctor has prescribed the right medicine for the markets consistent with the macroeconomic headwinds and pending QT.
So i guess we better hope the sept low holds?
man is good is no good
Oh weren't you calling for a bull market left and right? Especially with TSLA couple days ago? What's this?
no, I was not. ONLY if certain price levels were broken to the upside AND price levels to the downside held. They did not. AND tsla has nothing to do with this, btw tesla is very close to confirming my five waves up. yup, i was right again!
So only if it goes up to certain levels its a bull? Real mind blowing analysis that is….LOL
 Can you link to the article where you confirm TSLA five waves up?
What a funny analysis garbage always said you are right if it missed then you said I mention before also even miss more than 5 % then you said not oo bad hahaha today it’s not 1950 everyone knows your analysis hahaha like Kramer
Omg this is getting beyond laughable. “I’ll share it when i get it” - so ill tell you what happened after it happened. It could go up or it could go down- either way its based on my principles. “I will monitor and adjust”- after im wrong, i will start a new ramble and so on and so on. It will never end. Nothing will be useful for trading, but i will keep trying to get realing bulls to subscribe to my after the fact and have it both ways methodologies. Get a real job, you are no different than the scammers telling me my car warranty is up…..
its about probability that is all.
i do know that- so why does he continuously try and fail miserably?
answer; because hes salesman looking to swindle the vunerable market participants. He’s also very insecure and petty. He cant help himself to argue and name call in comments with anyone that disagrees
Risk Disclosure: Trading in financial instruments and/or cryptocurrencies involves high risks including the risk of losing some, or all, of your investment amount, and may not be suitable for all investors. Prices of cryptocurrencies are extremely volatile and may be affected by external factors such as financial, regulatory or political events. Trading on margin increases the financial risks.
Before deciding to trade in financial instrument or cryptocurrencies you should be fully informed of the risks and costs associated with trading the financial markets, carefully consider your investment objectives, level of experience, and risk appetite, and seek professional advice where needed.
Fusion Media would like to remind you that the data contained in this website is not necessarily real-time nor accurate. The data and prices on the website are not necessarily provided by any market or exchange, but may be provided by market makers, and so prices may not be accurate and may differ from the actual price at any given market, meaning prices are indicative and not appropriate for trading purposes. Fusion Media and any provider of the data contained in this website will not accept liability for any loss or damage as a result of your trading, or your reliance on the information contained within this website.
It is prohibited to use, store, reproduce, display, modify, transmit or distribute the data contained in this website without the explicit prior written permission of Fusion Media and/or the data provider. All intellectual property rights are reserved by the providers and/or the exchange providing the data contained in this website.
Fusion Media may be compensated by the advertisers that appear on the website, based on your interaction with the advertisements or advertisers.
© 2007-2024 - Fusion Media Limited. All Rights Reserved.