Get 40% Off
🚨 Volatile Markets? Find Hidden Gems for Serious OutperformanceFind Stocks Now

Is S&P 500 Still On Target For 4300+?

Published 08/09/2022, 03:40 PM
Updated 07/09/2023, 06:31 AM

In June (see here), I warned of a potential bullish wedge pattern on the S&P500 (SPX) targeting 4300+. I followed up on that analysis a month later (see here) as the index confirmed the pattern by breaking out. The upside target remains ideally at SPX4365-4530:

a 62-76% retrace of the entire Year-To-Date Decline … if the current six-month-long diagonal pattern completes, I expect the rally to last longer than a few weeks.”

Yesterday, the index reached SPX4187, only 4.1% below the lower end of the already June projected upside target. So far, so good, but does this mean the counter-trend rally is over and a new bear market leg down has started? 

Figure 1 below shows the bearish Elliott Wave Principle (EWP) option I am tracking alongside a bullish one (not pictured).

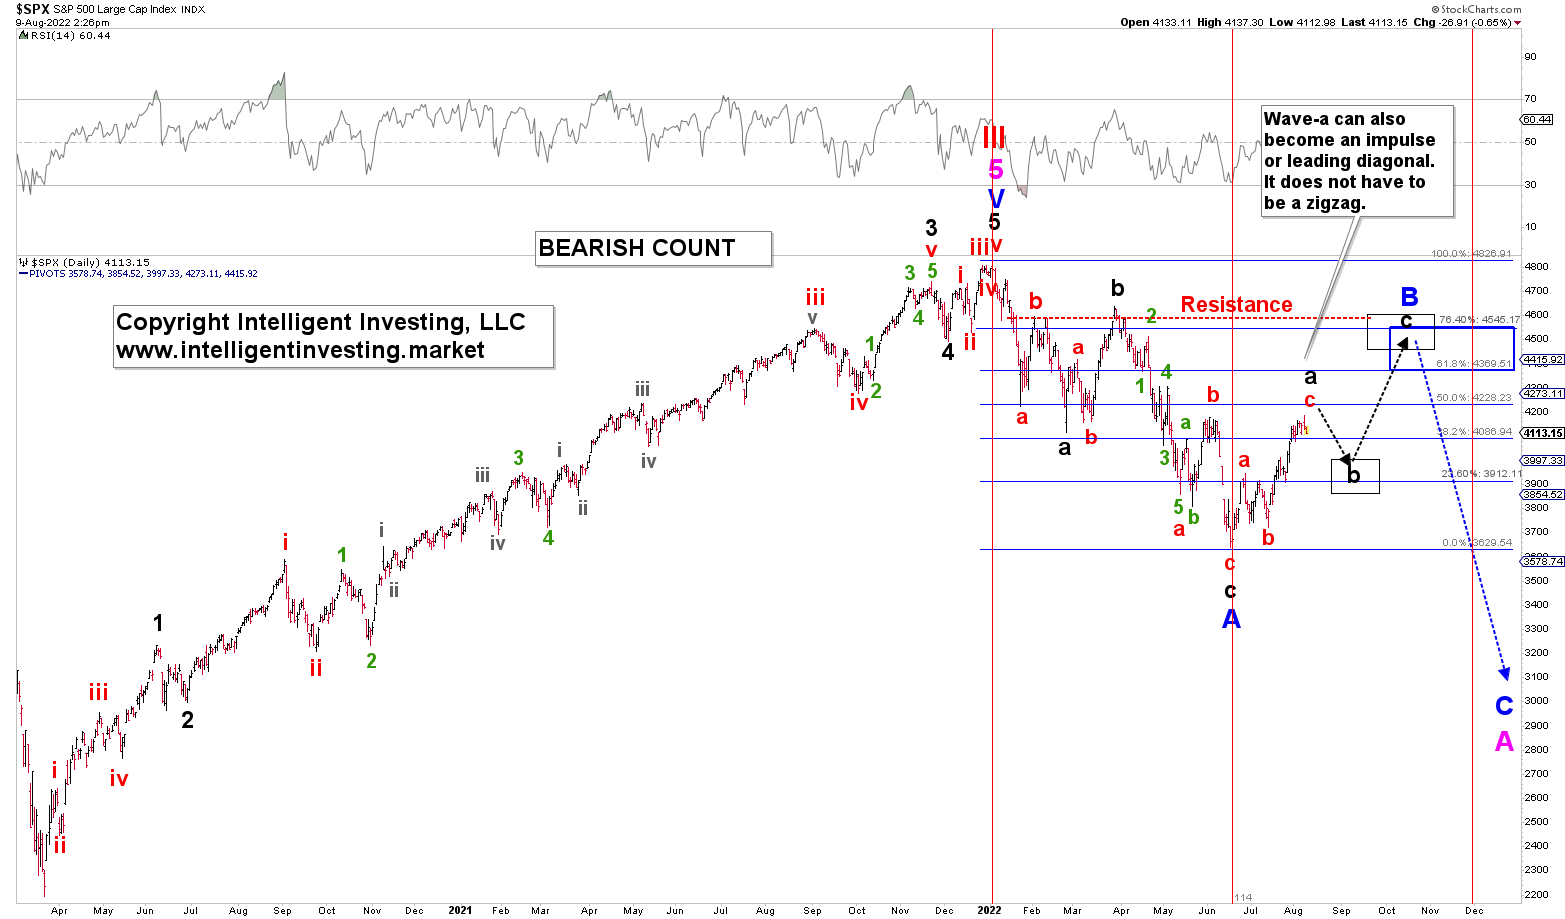
Despite a smaller 4th and 5th wave pattern higher, SPX4250+ cannot be ruled out just yet because a-waves can be either made up of three or five waves. Therefore, the index can have complete (black, major) wave-a of a larger (blue, Primary) wave-B bounce. 

B-waves always comprise only three waves: a-b-c. And while the index may have already completed a wave B, the recent breadth thrusts (see here and here) suggest odds favor more upside. 

Per this bearish EWP count, I am looking for a multi-day, overlapping pullback to the ideal lower black, boxed target zone (SPX3900+/-100). 

The next leg should kick off to around SPX4350, but possibly as high as SPX4500-4600 (the higher black, boxed target zone). Please note that the vertical lines represent time symmetry; it took 114 days from top to bottom, and I, therefore, expect this potential bounce only to last longer than the current two months.

3rd party Ad. Not an offer or recommendation by Investing.com. See disclosure here or remove ads .

Latest comments

Thanks Dr Schure, do you think the pullback would still happen? or it will just go straight up further?
So basically a pull back to 3900 and next level up???
Dear Dr.! Thank you for your article again! What is your current odds of SC IV is underway?
50/50
thanks for the education and the ideas
You are basically saying either up or down from here…. Maybe you could add probabilities for the different directions.
As usual when people say “all you say is it can go up or down” is in part because of confusing the short-term variability and lower odds with the clear intermediate-term direction. In this case higher. It is simply short-term a matter of how that will resolve: more variability. Intermediate term remains pointing higher!
Rarely do markets crash in August. So when I see all these bears calling for a pivot off the recent highs ahead of 4200 that makes me think a short squeeze is in order. Therefore I agree that there probably lots more upside in store, with first target 4300. But, your 4500-4600 seem to be probable as well especially if the squeeze really gets going. I have my support levels posted here, and prefer not to see S&P close below 4080, if so the last line of defense is 4000
Nope, it did in the summer of 84, during the famous oil crisis. Slow torturing dive day by day. I Googled and pulled those charts out.
 Key word is rarely. So as I betting man I do not bet on rarely.
 I'm seeing slow steady consolidation and grind upwards into resistance in the dead volume of summer so I think this would be very weak resistance.
So everyone here is bearish? I guess the correct play is to inverse them then.
If you look at the fear/greed index, it's right at 50.
Nope. Overall trend is down
UNLESS IT MOVES&TRADES ABOVE 4178 LEVEL WITH VOLUMES NO UPTREND EXPECTED
.786 Fibonacci level from COVID low has SPY at 275  before 2023
Going down. Head and Shoulders completed.
Bearish rising wedge broken down too.
I do not understand what you mean by ”only to last longer than these two months?
typo, disregard the word "only"
Thanx!
This is really an interesting and sophisticated approach. If yields and USD continue to correct, this theory has legs in the next months.
No. Spy will hit 350 next 3 months
350? emm ok.. I could see it fall to under 3,000 within the next 12 months should inflation stay above 4%+ and the fed get into a fight to prevent it from getting fully entrenched at high levels (or a number of other events emerge e.g China/Taiwan tensions rise further, EU/UK Brexit trade war, EU/Russia energy war or a US government budget showdown post-Nov mid terms etc). Could see the S&P follow 2000 and 2007 bear trends and fall by 50%+ against all-time highs should a global recession emerge - so potentially gradually falling to circa 2,200 - 2,300 over the next 18 or so months (versus its Nov 2021 highs of 4,600) before eventually rebounding.
china will keep the taiwan issue ignited not just to show her prowess but to hurt the world markets
Risk Disclosure: Trading in financial instruments and/or cryptocurrencies involves high risks including the risk of losing some, or all, of your investment amount, and may not be suitable for all investors. Prices of cryptocurrencies are extremely volatile and may be affected by external factors such as financial, regulatory or political events. Trading on margin increases the financial risks.
Before deciding to trade in financial instrument or cryptocurrencies you should be fully informed of the risks and costs associated with trading the financial markets, carefully consider your investment objectives, level of experience, and risk appetite, and seek professional advice where needed.
Fusion Media would like to remind you that the data contained in this website is not necessarily real-time nor accurate. The data and prices on the website are not necessarily provided by any market or exchange, but may be provided by market makers, and so prices may not be accurate and may differ from the actual price at any given market, meaning prices are indicative and not appropriate for trading purposes. Fusion Media and any provider of the data contained in this website will not accept liability for any loss or damage as a result of your trading, or your reliance on the information contained within this website.
It is prohibited to use, store, reproduce, display, modify, transmit or distribute the data contained in this website without the explicit prior written permission of Fusion Media and/or the data provider. All intellectual property rights are reserved by the providers and/or the exchange providing the data contained in this website.
Fusion Media may be compensated by the advertisers that appear on the website, based on your interaction with the advertisements or advertisers.
© 2007-2024 - Fusion Media Limited. All Rights Reserved.