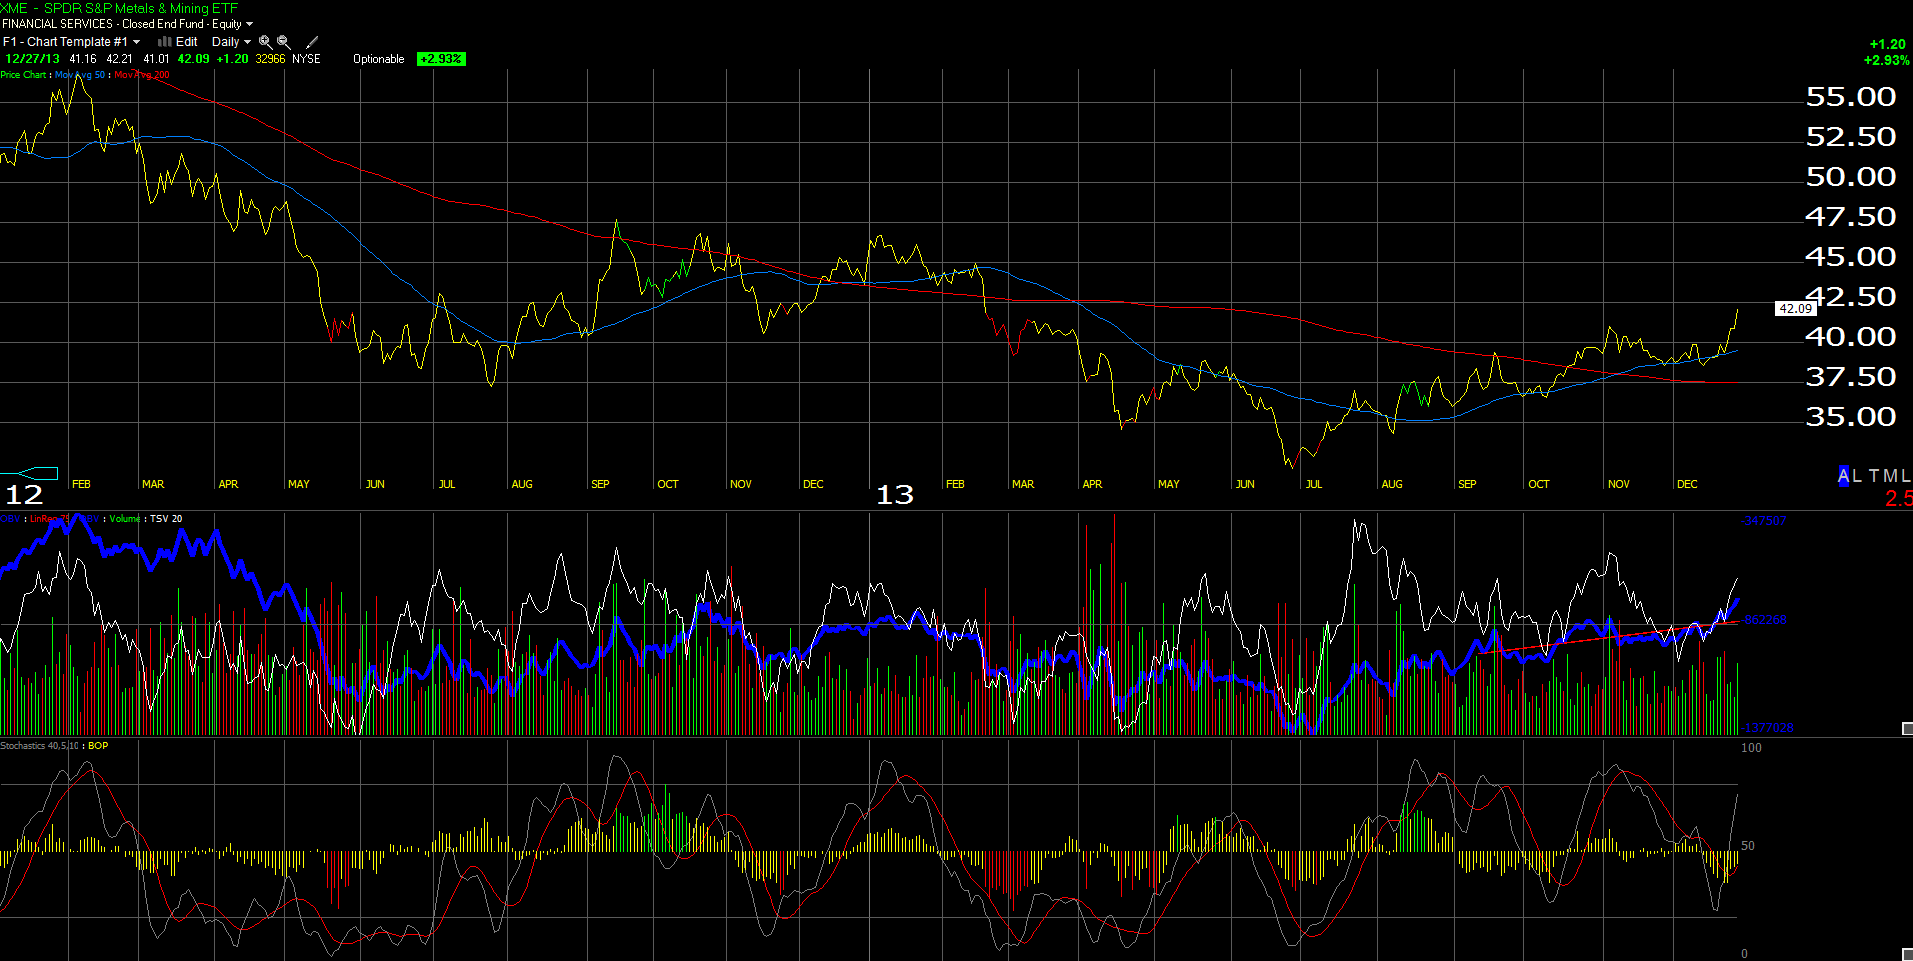
We are starting to see a little life in the commodity sector. This weekend, one of my former fellow contributors on TheStreet.com, Helene Meisler (@hmeisler), posted this chart of the XME (under a “Guess This Chart” Tweet).
The SPDR S&P Metals & Mining ETF, (XME), chart above, looks to be breaking out of a full-year consolidation. Helene is a pretty good technician, and likes to identify early opportunities from a technical analysis perspective. The top 5 holdings of the XME (per Morningstar) are:
- AK Steel (AKS) - 4%
- Alcoa (AA) – 3.33%
- Walter Energy (WLT) - 3.29%
- US Steel (USX) – 3.27%
- Freeport Copper (FCX) – 3.27%
We are more of a fundamental-analysis shop, and with technical analysis, like to combine sector earnings analysis as well as individual company metrics to drive the investment strategy. (We are currently long Alcoa, (AA), US Steel (X), and Freeport Copper (FCX).)
We started to get interested in Basic Materials in late July ’13 when our three primary holdings were seeing earnings reports that were quite pessimistic. (We have been long AA forever, and added to X and FCX this year.)
The Basic Materials sector is roughly 70% Chemicals and a big chunk of that is presumably Dow Chemical (DOW) and DuPont (DD).
The other 30% is where we are focused and is what I call the non-precious metals ie aluminum, copper and steel (and such).
The history of Basic Materials earnings has been pretty volatile: here is the sector earnings growth detail (per Thomson Reuters):
- Q3 ’13: +8% (technically not final yet, but it will be next week)
- Q2 ’13: -8.4%
- Q1 ’13: +1.5%
- Q4 ’12: +13.7%
- Q3 ’12: -26.6%
- Q2 ’12: -16%
- Q1 ’12: -8%
- Q4 ’11: -14.2%
- Q3 ’11: 30.5%
- Q2 ’11: 50%
- Q1 ’11: 52%
- Q4 ’10: 49%
- Q3 ’10: 41%
- Q2 ’10: 111%
- Q1 ’10: +210.7%
- Q4 ’09: 221%
- Q3 ’09: -48.5%
- Q2 ’09: -67.5%
Readers can clearly see the boom-and-bust cycle within the sector, some of which undoubtedly can be attributed to the slowdown off the 2008 Recession (not to mention the slowing of the Chinese economy from the mid 15% quarterly GDP growth rate in the mid 2000′s, such as 2006 and 2007), to the point where we are today, with Q3 ’13 about finalized, and the developed economies poised for better global growth in 2014.
Looking ahead into 2014, what are the expectations for Basic Materials earnings growth as a sector?
- Q4 ’13: +6.9% (est)
- Q1 ’14: +9.9% (est)
- Q2 ’14: +20.4% (est)
- Q3 ’14: +19.2% (est)
To be clear, the revisions are still negative for the sector, which means as we move closer to each quarter, the expected earnings growth rate gets revised lower. For example, for Q4 ’13′s current +6.9% expected growth rate, the same growth rate was 23% on July 1 ’13.
What I’ll be looking for from a sector perspective, is for the actual growth rate to start exceeding the S&P 500 quarterly growth rate. Basic Mat’s earnings growth rate has not materially exceeded the S&P 500′s quarterly growth rate since Q4 ’12, when the sector grew 13.7%, versus the S&P 500′s 6%. It has been a while since Basic Materials has shown decent relative earnings performance.
The Materials Select Sector SPDR ETF, (XLB), another fund in this sector, is currently weighted towards the appropriate weighting of the S&P 500 Basic Mat sector as a whole:
- Monsanto (MON): 10.47%
- DuPont (DD): 10.47%
- Dow Chemical (DOW): 9.34%
- Freeport (FCX): 6.72%
- Praxair (PX): 6.60%
The XLB is more heavily weighted to the traditional Chemical weighting in the Basic Mat sector. We do not own any XLB, and if we were to play the sector through ETFs we would use XME at this point.
We are long Alcoa (AA), US Steel (X) and Freeport (FCX) for the following reasons:
1.) Alcoa (AA) has been a holding since ’09 and it is still trading below tangible book value. The stock has rallied nicely in Q4 ’13, closing its underperformance gap, but I think it still has further upside given the global economic recovery and the continued strong downstream demand for aluminum. I think the stock could trade to $20 in 2014;
2.) We started buying US Steel (X) in May ’13 at $17.60 per share. The stock has had a strong 2nd half ’13 and will also benefit from improving demand thanks to stronger global growth;
3.) Freeport (FCX) is a little bit of a wildcard for us. The acquisition of MMO was pretty dicey, and the merger reduced FCX’s dependence on copper somewhat. The recent pop in the price of copper from $3.40 to $3.80 has FCX perking up a little.
All three stocks are dependent on aluminum pricing (AA), steel pricing (X) and copper pricing (FCX somewhat).
We’ll be out with more individual analysis on these three later. For now, I particularly like the above 3 stocks into the July ’14 earnings reports, when comp’s will get tougher. We have full positions now in the three names although that could change. Our overall Basic Mat weighting in client accounts is 4% – 5% depending on the account, and that could change after we see Q4 ’13 earnings in January.
Alcoa will be the first to report in early January ’14.
