
Bank of the Ozarks, Inc.’s (NASDAQ:OZRK) second-quarter 2017 earnings of 73 cents per share were in line with the Zacks Consensus Estimate. The figure improved 21.7% on a year-over-year basis.
A rise in net interest income and fee income acted as tailwinds. Also, enhanced loans and deposits supported the results. However, the company witnessed a significant jump in expenses during the quarter, along with higher provision for loan and lease losses.
Net income available to common shareholders came in at $90.5 million, surging 66.2% year over year.
Revenue Growth Offsets Rise in Costs
Net revenue grew 65% from the prior-year quarter to $233.9 million. Also, the figure surpassed the Zacks Consensus Estimate of $231.1 million.
Net interest income jumped 69.8% year over year to $202.1 million. Further, net interest margin, on a fully taxable equivalent basis, increased 17 basis points (bps) to 4.99%.
Non-interest income totaled $31.8 million, up 40.1% from the year-ago quarter. The rise mainly reflected higher service charges on deposit accounts, BOLI income and other income.
Non-interest expenses were $83.8 million, up 64.6% year over year. The increase was due to a rise in all the expense components.
Bank of the Ozarks’ efficiency ratio was 35.32% compared with 35.41% in the prior-year quarter. A fall in efficiency ratio indicates higher profitability.
Strong Balance Sheet
As of Jun 30, 2017, total loans and leases (including purchased loans) were $15.2 billion, up 56.1% year over year, while total deposits surged 59.3% year over year to $16.2 billion.
Further, as of the same date, the company had total assets of $20.1 billion, while shareholders equity was $3.3 billion.
Worsening Credit Quality
The ratio of non-performing loans and leases, as a percentage of total loans and leases, increased 2 bps to 0.11% as of Jun 30, 2017. Also, provision for loan and lease losses increased 26.3% from the prior-year quarter to $6.1 million.
However, annualized net charge-off ratio for all loans and leases fell 1 bp year over year to 0.05%.
Profitability Ratios Deteriorate
At the end of the reported quarter, return on average assets was 1.90%, down from 1.91% in the year-ago quarter. Additionally, return on average common equity decreased from 14.35% to 12.00%.
Our Take
The results reflect improvement in margins and loan growth. Bank of the Ozarks is well poised for steady earnings growth driven by solid rise in revenues and inorganic growth strategy.
However, mounting costs remain a major concern for the company. In fact, expenses are expected to continue rising as the company is expanding into newer areas organically as well as through acquisitions.
Also, continuous increase in provision for loan losses is another major issue. Further, its exposure to real estate loans might hurt its financials in the near term.
Bank of the Ozarks Price, Consensus and EPS Surprise
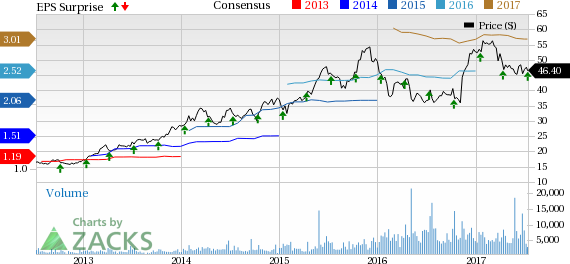
Bank of the Ozarks Price, Consensus and EPS Surprise | Bank of the Ozarks Quote
Bank of the Ozarks currently carries a Zacks Rank #4 (Sell).
You can see the complete list of today’s Zacks #1 Rank (Strong Buy) stocks here.
Among other Southeast banking stocks, First Horizon National Corporation (NYSE:FHN) is slated to report results on Jul 14, BancorpSouth, Inc. (NYSE:BXS) is scheduled to report earnings on Jul 19 and Regions Financial Corporation (NYSE:RF) is slated to report its numbers on Jul 21.
More Stock News: This Is Bigger than the iPhone!
It could become the mother of all technological revolutions. Apple (NASDAQ:AAPL) sold a mere 1 billion iPhones in 10 years but a new breakthrough is expected to generate more than 27 billion devices in just 3 years, creating a $1.7 trillion market.
Zacks has just released a Special Report that spotlights this fast-emerging phenomenon and 6 tickers for taking advantage of it. If you don't buy now, you may kick yourself in 2020. Click here for the 6 trades >>
Regions Financial Corporation (RF): Free Stock Analysis Report
First Horizon National Corporation (FHN): Free Stock Analysis Report
BancorpSouth, Inc. (BXS): Free Stock Analysis Report
Bank of the Ozarks (OZRK): Free Stock Analysis Report
Original post
Zacks Investment Research