
Avon Products Inc. (NYSE:AVP) reported mixed financial numbers for third-quarter 2019. While the company’s earnings surpassed the Zacks Consensus Estimate for the third straight quarter, revenues missed the same. The bottom-line growth can be attributed to improvement in adjusted operating margin. Also, the company is progressing well with its “Open Up Avon” strategy. Let’s delve deeper.
Q3 in Detail
Avon’s adjusted earnings of 11 cents per share beat the Zacks Consensus Estimate of 3 cents. In the year-ago quarter, the company posted break-even earnings. On a GAAP basis, the company delivered earnings of 21 cents per share, which remained flat year over year.
Total revenues for Avon declined 17% year over year to $1,188 million and missed the Zacks Consensus Estimate of $1,226 million. In constant dollars, total revenues dipped 6%. Further, total Reportable Segment revenues (in reported currency) declined 11% to $1,183.3 million. In constant currency, total Reportable Segment revenues dropped 6% due to decrease in unit volume from less profitable products.
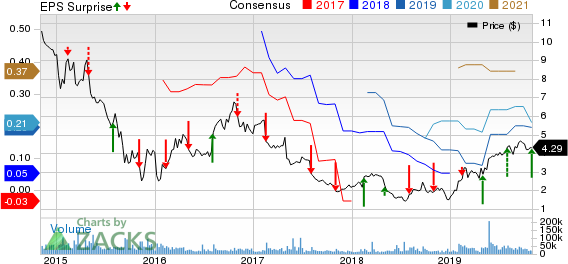
Avon Products, Inc. Price, Consensus and EPS Surprise
Average Representatives sales in constant dollars improved 4% while price/mix rose 9%, driven by growth in all reportable segments.
Adjusted gross margin expanded 100 basis points (bps) to 58.1%, driven by price/mix, which offset adverse impact of foreign currency fluctuations.
Also, the company’s focus on pricing and productivity gains during the quarter drove adjusted operating margin expansion.
Avon’s adjusted operating margin expanded 300 bps to 6%. This growth was mainly driven by increased savings across multiple cost lines and improved price/mix due to pricing efforts. The metric increased despite adverse impacts of foreign currency, which impacted adjusted operating margin by 163 bps.
Segmental Performance
Avon’s Europe, Middle East & Africa segment generated revenues of $398.3 million, which fell 10% year over year. On a currency-neutral basis, revenues were down 7%. Results included a 6% decline in Active Representatives, 1% decrease in Average Representatives Sales and a 13% fall in units sold. These were offset by 6% growth in price/mix.
South Latin America’s revenues declined 23% to $494 million and were down 3% on a constant-dollar basis. In the reported quarter, Active Representatives declined 10%, with units sold falling 16%. However, the segment witnessed a 7% increase in Average Representatives Sales and 13% rise in price/mix.
North Latin America’s revenues dropped 11% year over year to $184.7 million and were down 9% in constant dollars. While Active Representatives were down 13% year over year, units sold fell 15%. However, the segment reported 4% gain in Average Representatives Sales and 6% growth in price/mix.
Asia Pacific’s revenues declined 12% to $106.3 million and dropped 13% in constant dollars mainly as Active Representatives decreased 19% and units sold fell 21%. However, this was partly offset by 6% rise in Average Representatives sales and 8% growth in price/mix.
Financial Details
Avon ended the quarter with cash and cash equivalents of $564.2 million, long-term debt of $1,589.1 million, and total shareholders’ deficit of $875.2 million (excluding non-controlling interests).
Notably, pricing and productivity initiatives under the Open Up Avon strategy significantly aided profitability and free cash flow in the third quarter. The company reported free cash flow of $64.8 million in the quarter, reflecting significant improvement from $16.3 million in the year-ago quarter.
Additionally, net cash provided by operating activities of continuing operations was $30.3 million for the quarter ended Sep 30, 2019, down from $38.4 million reported in the year-ago quarter.
We note that shares of this Zack Rank #3 (Hold) company have gained approximately 52% in the past six months, outperforming the industry’s growth of 11.3%.
3 Key Picks
e.l.f. Beauty, Inc. (NYSE:ELF) , with a Zacks Rank #1 (Strong Buy), has an impressive earnings surprise record. You can see the complete list of today’s Zacks #1 Rank stocks here.
Helen of Troy Limited (NASDAQ:HELE) currently has a long-term earnings growth rate of 7.6% and a Zacks Rank #2 (Buy).
Inter Parfums, Inc. (NASDAQ:IPAR) , a Zacks Rank #2 stock, has a long-term earnings growth rate of 12.5%.
7 Best Stocks for the Next 30 Days
Just released: Experts distill 7 elite stocks from the current list of 220 Zacks Rank #1 Strong Buys. They deem these tickers “Most Likely for Early Price Pops.”
Since 1988, the full list has beaten the market more than 2X over with an average gain of +24.5% per year. So be sure to give these hand-picked 7 your immediate attention.
See them now >>
Avon Products, Inc. (AVP): Free Stock Analysis Report
Inter Parfums, Inc. (IPAR): Free Stock Analysis Report
Helen of Troy Limited (HELE): Free Stock Analysis Report
e.l.f. Beauty Inc. (ELF): Free Stock Analysis Report
Original post
Zacks Investment Research