Along with travel, the retail sector took a very severe hit from the COVID-19 lockdown. Most restaurants, apparel shops and department stores are closed for an indefinite period of time. This, in turn, creates a lot of headaches for the landlords, as well. Even dividend aristocrats like Realty Income (NYSE:O) took heavy losses.
The company owns and leases over 6400 commercial real estate properties. Who could predict that the majority of them would have to close due to a global pandemic? We certainly couldn’t. What we did instead was look for the Elliott Wave patterns on Realty Income’s charts.
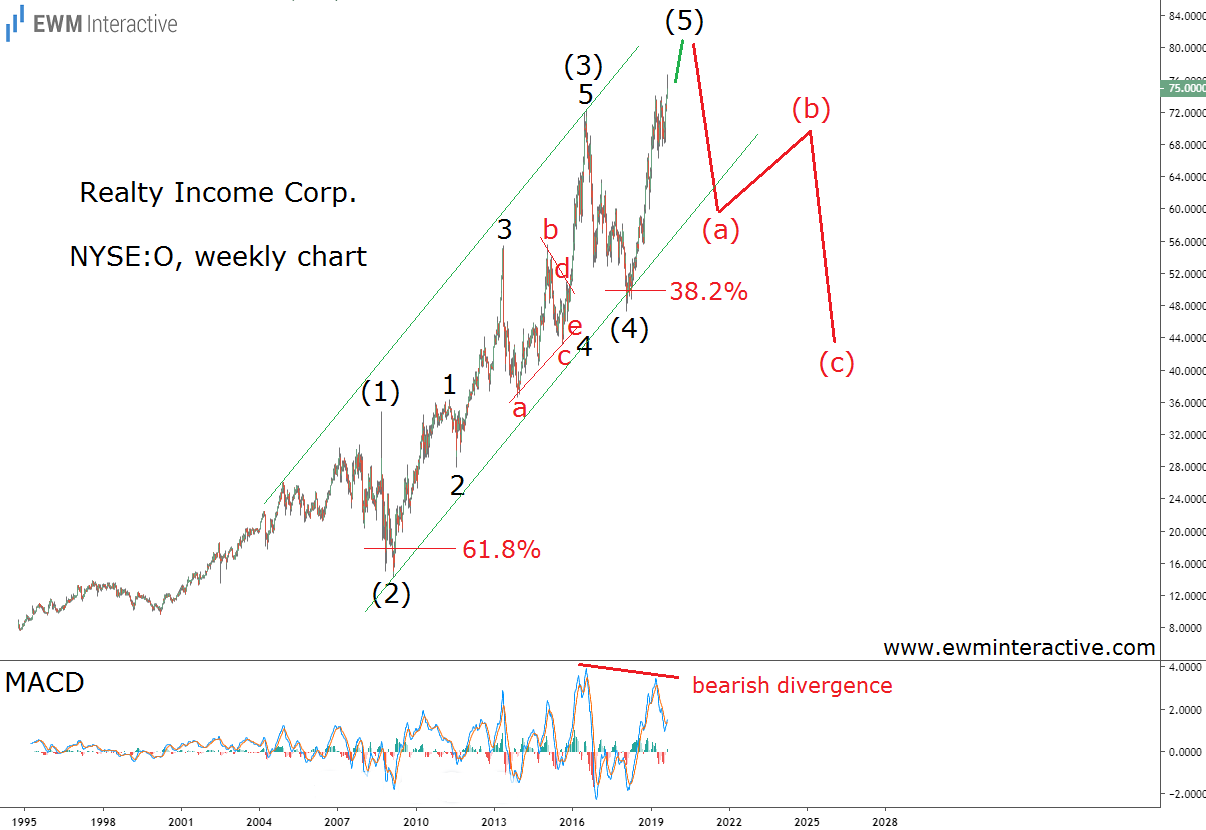
Over seven months ago, on September 6th 2019, we found one. The stock was still comfortably hovering around $75 a share. Even the Chinese did not know what COVID-19 was back then. Yet, Realty Income’s chart was already sending a warning. Take a look.

The chart allowed us examine the structure of Realty Income’s uptrend since its IPO in 1994. It looked like a textbook five-wave impulse developing within the parallel lines of a trend channel. We labeled the pattern (1)-(2)-(3)-(4)-(5) and the sub-waves of wave (3) were also visible.
This Pattern Meant Nothing Good for Realty Income Investors
The theory states that a three-wave correction follows every impulse. So instead of joining the bulls near $75, we did not to trust them at all. The support of wave (4) near $45 was a reasonable bearish target, implying 40% downside. The bearish MACD divergence further reinforced the negative outlook.

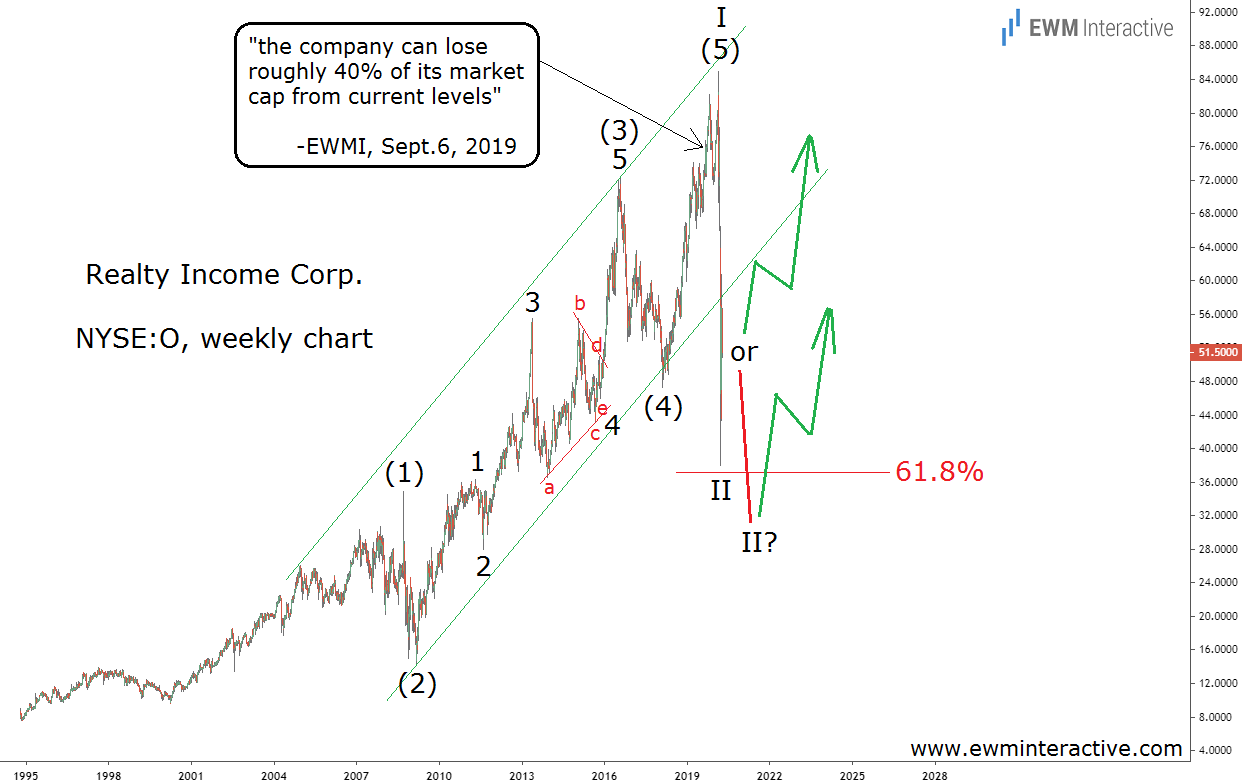
Realty Income didn’t lose 40%. From top to bottom, it lost 55% as it crashed from $84.63 to $38.02 in just a month. Nobody could’ve predicted the pandemic. From an Elliott Wave perspective though, the crash it caused made perfect sense. In our opinion, if it wasn’t for the virus, something else was going to drag the stock down.
Now, with Realty Income currently around $50, two possibilities exist. One, the stock recovers the way Cigna (NYSE:CI) did after its 2008 crash. Or two, the correction from $84.63 evolves into a more distinctive three-wave structure and touches the 61.8% Fibonacci level once more.
Whichever the market chooses, the risk/reward ratio is much improved from seven months ago. The 5-3 wave cycle since 1994 is either complete or near completion. The uptrend can be expected to resume soon.
