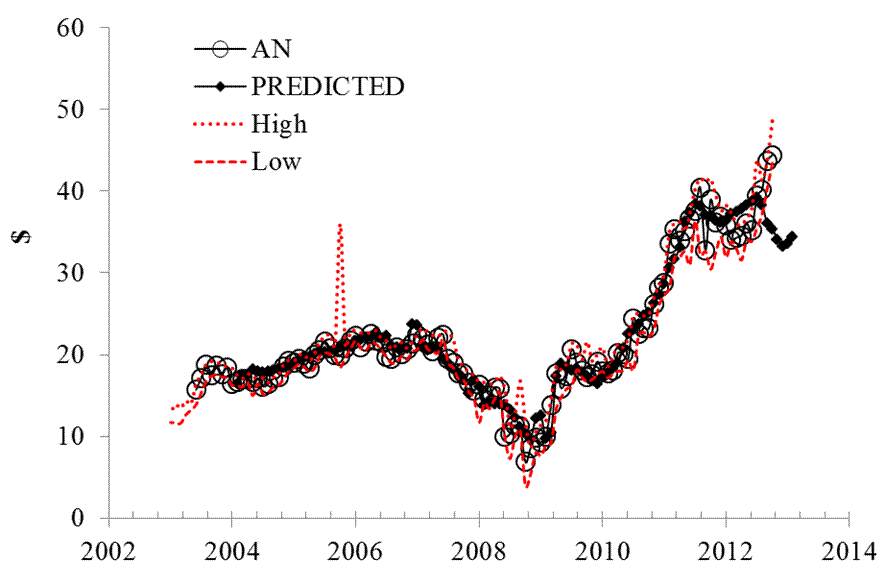
Here we revisit our price model for AutoNations (AN), which we have been modeling since 2009. In March 2012, we presented a new prediction for AN in which we expected no large changes in the first half of 2012. At least the price was not expected to go out of the uncertainty bounds defined by monthly high/low prices. This prediction was right. The AN (monthly closing) price was hovering around $35 before it started to grow in July and reached the level of $44 in September 2012. Our current model shown the price to fall back to $35 in the months to come. The closing price for the 12th of November was $40.56, i.e. approximately 10% down from the October’s closing price. The model suggests that no recommendation to buy AN should be given and there is no reason to keep it in the short run (few months). We will revisit the model in two-three months.
Two Best CPIs
AutoNations is a company from the services sector (as defined by the S&P 500) and operates as an automotive retailer in the U.S. here we present the current model, which has been obtained by decomposition of the time series of monthly closing share prices (adjusted for splits and dividends) into a weighted sum of two consumer price indices. One might presume that a fast growth in the CPI inherently linked to the AN share price (e.g. energy consumer price for energy companies) relative to some independent by dynamic reference should be manifested in a higher pricing power for the company. Therefore, the task is to find the two best (say, in sense of RMS residual error) defining CPIs. It allows testing of the underlying concept (decomposition into CPIs) and to estimate time lags and coefficients for AN.
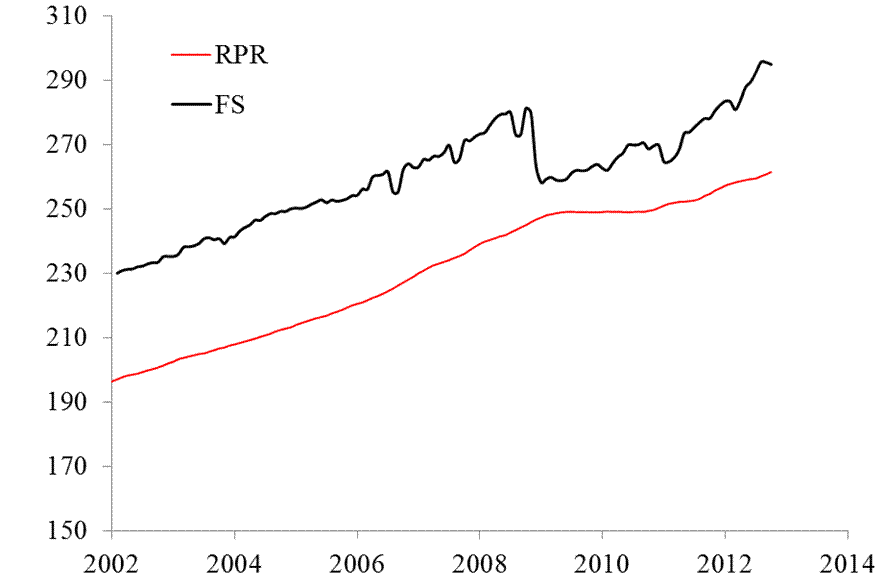
We have borrowed the time series of monthly closing prices of AN from Yahoo.com and the relevant (seasonally not adjusted) CPI estimates through September 2012 are published by the BLS. The evolution of AN share price is defined by the consumer price of rent of primary residence (RPR) and the index of financial service (FS). In March 2012, the defining time lags were as follows: the RPR index leads the price by 10 months and the FS index leads by 5 months. The revised model has only one difference, the lag of RPR is one month longer. The relevant best-fit models for AN(t) are as follows:
AN(t) = -1.89RPR(t-10) – 0.36FS(t-5) + 15.47(t-1990) + 270.31, February 2012
AN(t) = -1.95RPR(t-11) – 0.37FS(t-5) + 16.08(t-2000) + 439.34, September 2012
where AN(t) is the AN share price in U.S. dollars, t is calendar time. This model is valid since August 2011 with the same lags and coerffcients. Figure 1 displays the evolution of both defining indices since 2002. Due to the negative coefficient (slope), the sharp drop in the FS index in 2009 best explaines the jump in the share price five months later.
Monthly Highs And Lows
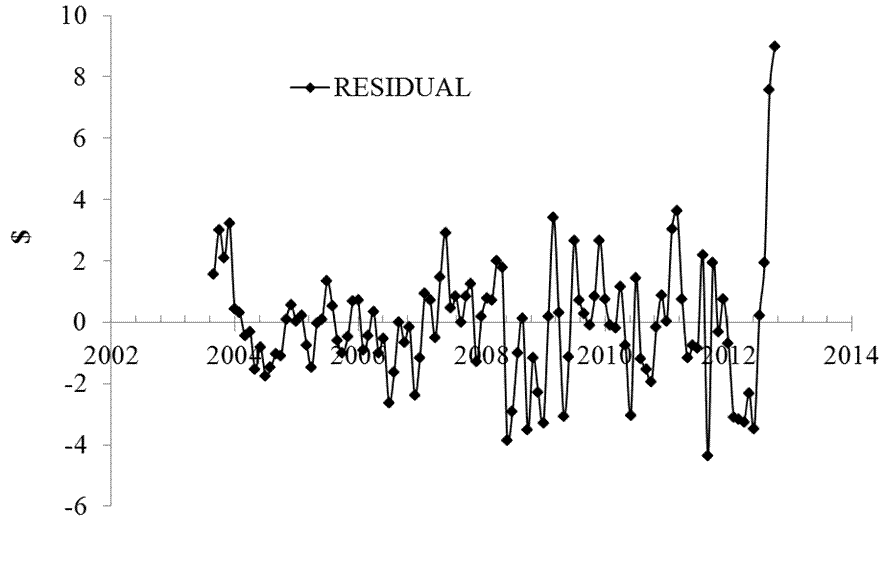
Figure two depicts the high and low monthly prices for the share together with the predicted and measured monthly closing prices. The predicted prices are well within the bounds of the share price uncertainty before June 2012 and then the curves deviate. This deviation has been growing and presented the challenge to the model. It also supposed that the probability for the price to fall has been increasing with time. The model residual error is shown in Figure 3 with the standard deviation between July 2003 and September 2012 of $2.01.
Both CPIs have negative influence on the share price. Therefore, the price should decrease when the indices grow fast.


- English (UK)
- English (India)
- English (Canada)
- English (Australia)
- English (South Africa)
- English (Philippines)
- English (Nigeria)
- Deutsch
- Español (España)
- Español (México)
- Français
- Italiano
- Nederlands
- Português (Portugal)
- Polski
- Português (Brasil)
- Русский
- Türkçe
- العربية
- Ελληνικά
- Svenska
- Suomi
- עברית
- 日本語
- 한국어
- 简体中文
- 繁體中文
- Bahasa Indonesia
- Bahasa Melayu
- ไทย
- Tiếng Việt
- हिंदी
Autonation's Share May Fall In Q4
Published 11/13/2012, 12:00 PM
Updated 07/09/2023, 06:31 AM
Autonation's Share May Fall In Q4
Latest comments
Loading next article…
Install Our App
Risk Disclosure: Trading in financial instruments and/or cryptocurrencies involves high risks including the risk of losing some, or all, of your investment amount, and may not be suitable for all investors. Prices of cryptocurrencies are extremely volatile and may be affected by external factors such as financial, regulatory or political events. Trading on margin increases the financial risks.
Before deciding to trade in financial instrument or cryptocurrencies you should be fully informed of the risks and costs associated with trading the financial markets, carefully consider your investment objectives, level of experience, and risk appetite, and seek professional advice where needed.
Fusion Media would like to remind you that the data contained in this website is not necessarily real-time nor accurate. The data and prices on the website are not necessarily provided by any market or exchange, but may be provided by market makers, and so prices may not be accurate and may differ from the actual price at any given market, meaning prices are indicative and not appropriate for trading purposes. Fusion Media and any provider of the data contained in this website will not accept liability for any loss or damage as a result of your trading, or your reliance on the information contained within this website.
It is prohibited to use, store, reproduce, display, modify, transmit or distribute the data contained in this website without the explicit prior written permission of Fusion Media and/or the data provider. All intellectual property rights are reserved by the providers and/or the exchange providing the data contained in this website.
Fusion Media may be compensated by the advertisers that appear on the website, based on your interaction with the advertisements or advertisers.
© 2007-2024 - Fusion Media Limited. All Rights Reserved.
