I. Oil
The S&P 500 lost 8% in the first two weeks of 2016, experiencing a new 52-week low of 1,857 during intraday movement on Friday, Jan. 15th. At one point the Dow Jones 30 was down by 500 points. Twelve hours prior to the selloff in the US, China officially entered a bear market – the Shanghai Composite Index had fallen by 20% since its December high. Adding to the equation for the perfect storm, oil closed below $30 a barrel for the first time in 12 years.
Ever since oil fell under $40 in December, the US equity market has been pushed heavily downward, despite the temporary bounce when the market embraced the Fed’s highly anticipated rate-hike decision on December 16th, with the S&P 500 jumping 1.5% to 2,073. Figure 1 illustrates how oil and equity prices have tangled downward neck and neck since Brent Crude touched $40 in December. The contemporaneous correlation between Brent and the S&P 500 is unbelievably high at 91.39%, comparable to the correlation between US GDP and the S&P 500.
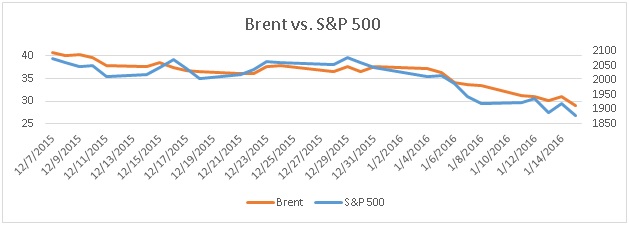
Figure 1. Brent Crude vs. the S&P 500 since 12/7/2016
Are the oil and equity markets always this closely correlated? Not really. As a matter of fact, their relationship is generally fairly volatile. For example, if we expand our horizon to a five-year period, as illustrated in Figure 2, the correlation suddenly becomes -71.80% – a significantly negative relationship. The divergence between oil and the market started at the end of August 2014, when oil broke $100 per barrel. According to Barclays (L:BARC), the correlation between the stock market and crude oil is merely 25% over the past 20 years. Why do we all at a sudden see such a tight race downward between the oil and equity markets? Random walk theory argues that market price is unpredictable. However, empirical evidence suggests that asset prices tend to be correlated in downside movement, and a downward drift is often observed, which is why we have negative momentum. The fact that oil has kept breaking the psychological barriers of $100, $90, $80, $70… all the way to $30 has shattered investors’ confidence and made many of them hit the panic button.
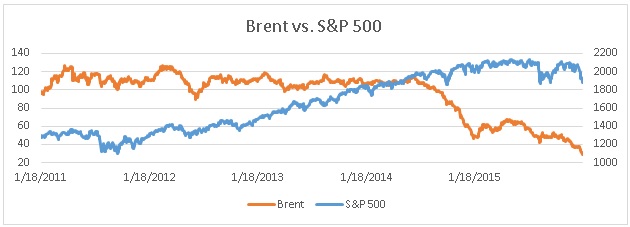
Figure 2. Brent Crude vs. S&P 500 since 1/18/2011
II. China
Global investors are all eyes on China nowadays. The newly devised circuit breaker halted the Shanghai Stock Exchange twice out of the first four trading days in 2016, triggering the global equity rout. Figure 3 shows that the correlation between the equity markets of the US and China since 2016 opened is 90.30%, whereas the correlation between these two markets in the past ten years is only 20.98%, as demonstrated in Figure 4.
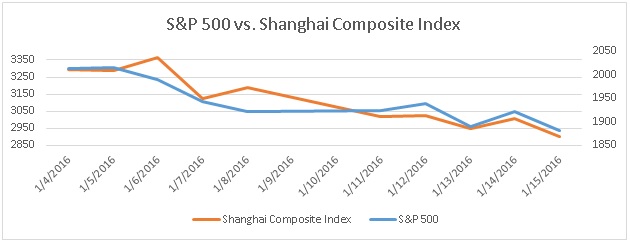
Figure 3. Shanghai Composite Index vs. S&P 500 since 1/4/2016
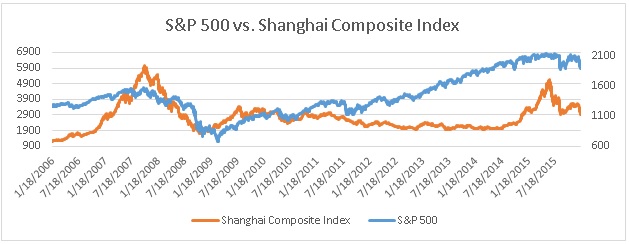
Figure 4. Shanghai Composite Index vs. S&P 500 since 1/18/2006
III. Recession
Short-term co-movement exists widely across various asset classes. Investor sentiment plays an important role in this case, which is why contrarians might point to an investor overreaction at present. Some of our clients ask if we are going into a recession in 2016. By definition, a recession occurs when GDP declines in two consecutive quarters. Given that we are still in a nearly zero interest-rate environment, and given that US job growth is exceeding expectations, we do not see the US in recession by the end of the year. However, the investor sentiment index AAII and market short-interest data coincidentally indicate that investors are as bearish as they were at the beginning of 2012, after the market went flat in 2011. Investor overreaction is a typical market irrationality. Unfortunately, the market can stay irrational longer than investors can stay solvent.
Last but not least, if indeed the market has overreacted to the recent oil price change and China’s stock market tumble, then the current market may have already priced in the possibility of an even lower price in oil and in China’s stock market. Hence, even if oil tumbles to $20 or China falls another 10%, equity prices may not be hurt as much going forward as they have been lately. On the flip side, the potential stock market rebound could be quite pleasant should we experience a positive price change in oil or a market recovery in China.
IV. Chinese New Year Effect
Chinese New Year is the most important holiday in Chinese culture. The Chinese stock market will be closed for a week. There is often a rally during the two weeks prior to the national holiday. As shown in the following table, the average two-week return is 4.06% in the past ten years. Although this result lacks statistical significance, the persistent pattern is uncanny. Will the US market benefit from the Chinese New Year rally in the upcoming weeks? We shall find out in the Year of the Monkey.
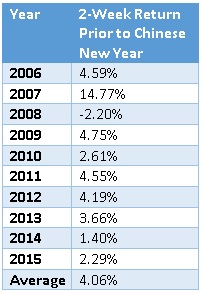
*Chinese New Year is Feb. 8, 2016.
by Leo Chen
