
As you can see on the daily chart below, China's Shanghai Index is struggling to stabilize at three-year lows.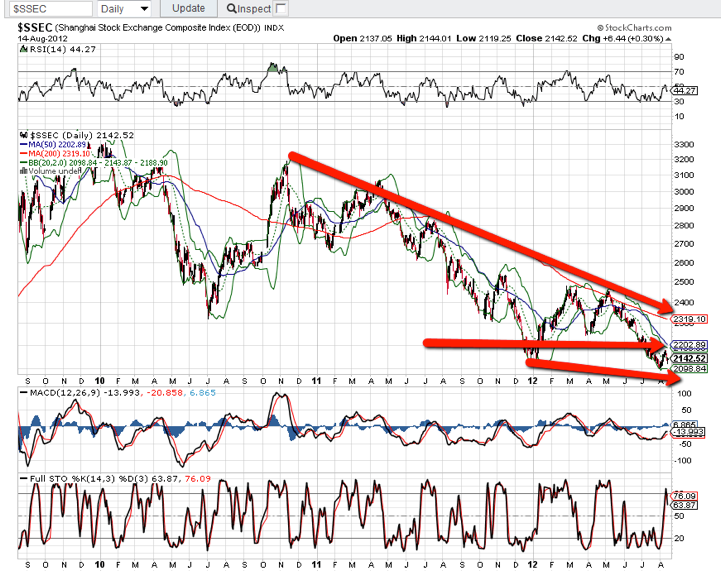
Hong Kong's Hang Seng Index has reached a major resistance level, as shown on the daily chart below.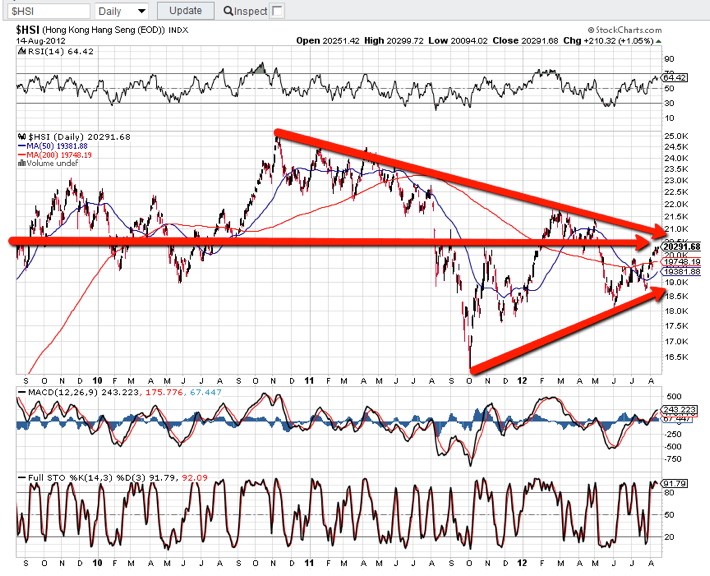
The next daily chart shows a ratio chart of the Hang Seng vs. the Shanghai Index. The Hang Seng has reached a major resistance point at its three-year highs on negatively-diverging RSI, MACD and Stochastics indicators. Watch for a pullback to the 9.25 level...a break below that could see a drop to its 50-sma at 8.80 or lower. Under that scenario, watch to see if the Shanghai Index breaks and holds below its recent lows (very bearish, which could prompt China to act with more stimulus measures...although, it may be waiting to see what the Fed does at its September 12th-13th meeting before committing any further funds).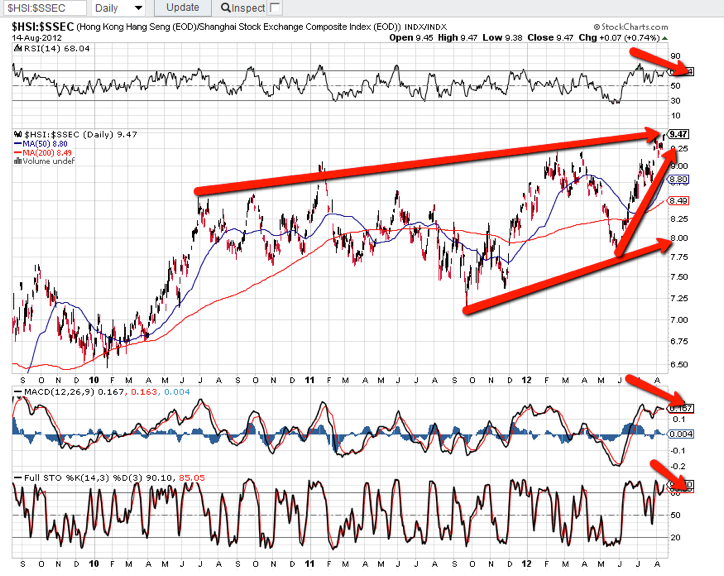
FX
The next daily chartgrid shows the Commodity ETF (DBC) and the AUD/USD forex pair. DBC is consolidating just beneath trendline resistance in overbought territory and the AUD/USD is flirting with 1.05 major support after reaching overbought conditions. They're worth watching for potential pullbacks if China's Shanghai and Hong Kong's Hang Seng weaken.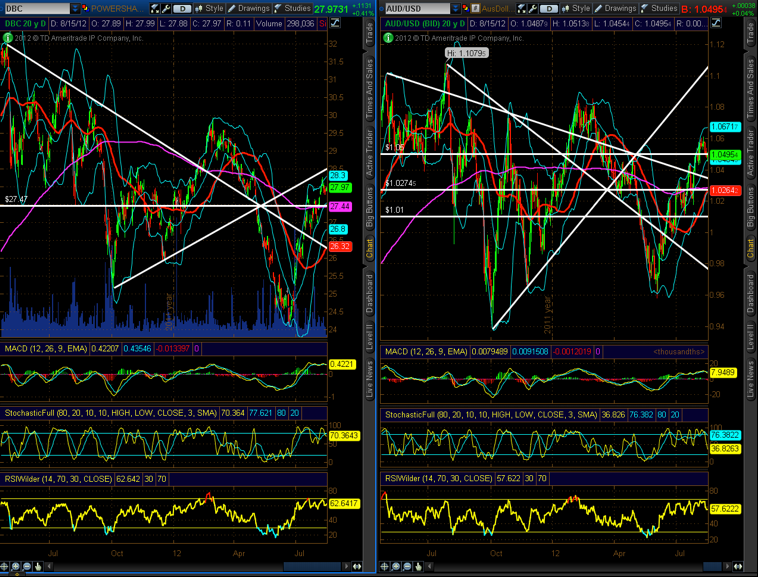 AUD/USD" width="758" height="577">
Oil
The last weekly chart of Oil shows that price has risen to a confluence of resistance at its 50-sma and 50% retracement level from its May 2011 high to its October 2011 low. Also, one to watch to see if weakness sets in -- or buying pressure steps up to launch and hold price above this resistance level.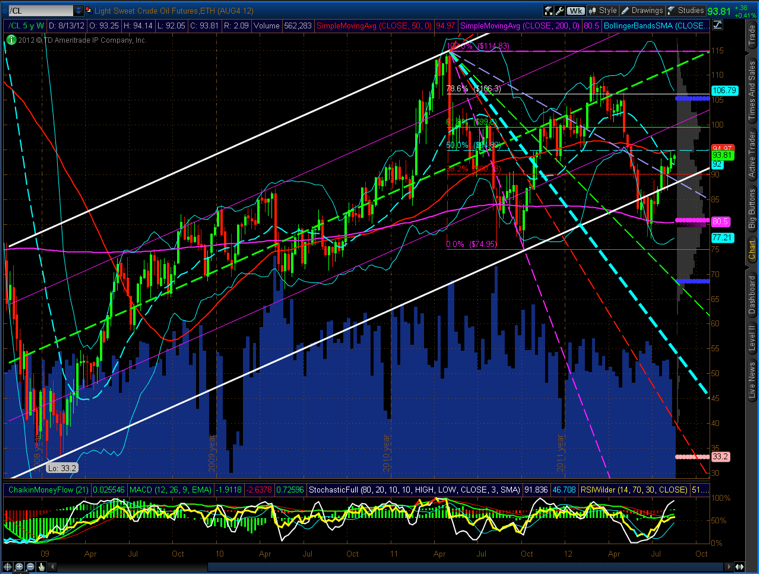
- English (UK)
- English (India)
- English (Canada)
- English (Australia)
- English (South Africa)
- English (Philippines)
- English (Nigeria)
- Deutsch
- Español (España)
- Español (México)
- Français
- Italiano
- Nederlands
- Português (Portugal)
- Polski
- Português (Brasil)
- Русский
- Türkçe
- العربية
- Ελληνικά
- Svenska
- Suomi
- עברית
- 日本語
- 한국어
- 简体中文
- 繁體中文
- Bahasa Indonesia
- Bahasa Melayu
- ไทย
- Tiếng Việt
- हिंदी
Asian Indices: Shanghai vs. Hang Seng
Published 08/15/2012, 11:25 AM
Updated 07/09/2023, 06:31 AM
Asian Indices: Shanghai vs. Hang Seng
Latest comments
Loading next article…
Install Our App
Risk Disclosure: Trading in financial instruments and/or cryptocurrencies involves high risks including the risk of losing some, or all, of your investment amount, and may not be suitable for all investors. Prices of cryptocurrencies are extremely volatile and may be affected by external factors such as financial, regulatory or political events. Trading on margin increases the financial risks.
Before deciding to trade in financial instrument or cryptocurrencies you should be fully informed of the risks and costs associated with trading the financial markets, carefully consider your investment objectives, level of experience, and risk appetite, and seek professional advice where needed.
Fusion Media would like to remind you that the data contained in this website is not necessarily real-time nor accurate. The data and prices on the website are not necessarily provided by any market or exchange, but may be provided by market makers, and so prices may not be accurate and may differ from the actual price at any given market, meaning prices are indicative and not appropriate for trading purposes. Fusion Media and any provider of the data contained in this website will not accept liability for any loss or damage as a result of your trading, or your reliance on the information contained within this website.
It is prohibited to use, store, reproduce, display, modify, transmit or distribute the data contained in this website without the explicit prior written permission of Fusion Media and/or the data provider. All intellectual property rights are reserved by the providers and/or the exchange providing the data contained in this website.
Fusion Media may be compensated by the advertisers that appear on the website, based on your interaction with the advertisements or advertisers.
© 2007-2024 - Fusion Media Limited. All Rights Reserved.