
Summary:
• The stock market rose last week, with the S&P 500 (SPX) up 17 points to 2819, an increase of 0.6%.
• Stocks were strong for most of the week, until the technology sector slipped with weak earnings reports from Facebook, Twitter, and Intel.
• Our projection this week is for stocks to have only minor downside risk, resting and trading in a narrow range.
The performance of the major stock indexes continued to diverge last week, with large cap indexes up 0.5-1.5% and the technology and small caps down 1-2%.
For tech, last week was actually a mixed bag, with Alphabet (NASDAQ:GOOGL) and Amazon (NASDAQ:AMZN) receiving a modestly positive reception to their earnings results. However, both Facebook (NASDAQ:FB) and Twitter (NYSE:TWTR) lost 20% of their value after earnings. Could this be an early indication that the mighty “FAANG” stocks that led the bull market are losing steam?
For the large cap indexes, the good news was a relaxation of trade tension between the US and Europe. President Trump and EU President Jean-Claude Juncker agreed to work toward zero tariffs, beginning with fresh talks on automobiles, steel, and aluminium. Meanwhile, the EU agreed to increase imports of liquified natural gas and soybeans from the US.
While trade tensions eased in some quarters, little progress was made in the US-China trade dispute. Nonetheless, the Chinese yuan lost another 0.6% in relation to the US dollar, its seventh consecutive weekly decline. As well, China rolled out a new stimulus program that included tax cuts and infrastructure spending.
As China seeks to prop up its economy, the US on Friday posted its strongest GDP figure since 2014, with QoQ growth of 4.1%, which was in line with Q2 expectations. Likewise, the Q1 figure was revised from 2% to 2.2%.
“As the trade deals come in one by one, we're going to go a lot higher than these numbers and these are great numbers,” according to Trump.
With the economy continuing to accelerate, it’s no surprise that profits are coming in stronger than expected. According to FactSet, with 53% of the S&P 500 having reported Q2 earnings, 83% of companies beat earnings estimates and 77% beat sales estimates.
Yet the housing market offered less impressive results. On Monday, the National Association of Realtors announced June existing home sales of 5.38 million, compared to estimates of 5.46 million. And on Wednesday, the Department of Commerce announced June new home sales of 631,000 compared to estimates of 669,000.
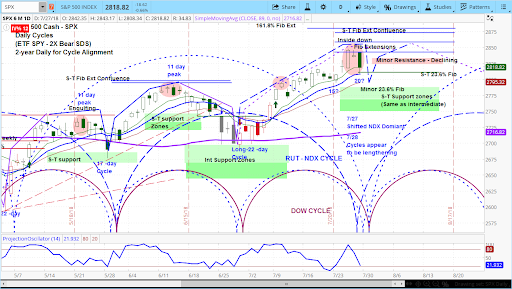
Our approach to technical analysis uses market cycles to project price action. Our current view on the SPX is to wait and see how it reacts once it starts the new cycle and approaches previous resistance. We can see that it is close to completing the declining phase of the current cycle, which has lasted 20 days while the previous cycles were at 22, 17, and 22 days.
In any case, we expect that this week the SPX will see some minor early weakness, then begin the rising phase for the next cycle. Recognizing that the overall pattern is bullish, our focus is on resistance at 2848 and 2873. And the quality of the next rally will tell a lot about the condition of the stock market.
For more from Slim, or to learn about cycle analysis, check out the askSlim Market Week show every Friday on our YouTube channel.