
Arrow Electronics Inc. (NYSE:ARW) reported impressive fourth-quarter 2017 results. The company’s quarterly revenues and earnings recorded year-over-year improvement, and also came above the guided range.
Arrow’s non-GAAP earnings of $2.51 per share came ahead of the Zacks Consensus Estimate of $2.30 per share. It also exceeded the guided range of $2.21-$2.37 (mid-point $2.29 per share). Moreover, earnings increased from $2.00 per share reported in the year-ago quarter.
Quarter in Detail
Arrow’s revenues, both on a reported and adjusted basis (excluding the impact of changes in foreign currencies and acquisitions), were $7.634 billion. On a reported basis, the figure was up 18.5% and on an adjusted basis it was up 15.1% from the year-ago quarter. Quarterly revenues also surpassed the Zacks Consensus Estimate of $7.446 billion and came above the guided range of $7.2 billion and $7.6 billion (mid-point $7.4 billion).
On a reported basis, revenues from Global components increased 23.8% to $4.945 billion. On an adjusted basis, the figure grew 20.7%. Geographically, adjusted Global components revenues from Asia climbed 14.4%. On a reported basis, the figure increased 15.5%. Global components contribution from Europe rose approximately 23.6% on an adjusted basis and 34.5% on a reported basis from the year-ago quarter.
Revenues at Global Enterprise Computing Solutions (ECS) came in at $2.689 billion, up 9.9% on a reported basis from the year-ago quarter. On an adjusted basis, revenues increased 6%. Adjusted ECS revenues from the Americas were up 4.9% while reported revenues were up 5.5% on a year over year basis. Reported ECS revenues from Europe increased 18.6% while adjusted revenues increased 7.9% from the year-ago period.
Gross margin contracted 310 basis points (bps) year over year and came in at 12.2%, primarily due to a higher mix of low margin supply chain activity compared to engineering design activity. The company reported that on a year-over-year basis, operating expenses increased 9% and as a percentage of revenues decreased 70 basis points. The increase in expenses was primarily attributed to strategic growth related initiatives of the company.
Arrow reported non-GAAP operating margin of 4.4%, up 20 bps. Moreover operating income, in dollar terms, increased 21% year over year to $339.6 million.
The company’s non-GAAP net income was $223.7 million compared with $181.7 million in the year-ago quarter.
Arrow exited the quarter with cash and cash equivalents of $730.1 million compared with $584.3 million reported in the previous quarter. Long-term debt (including current portion) was $2.93 billion compared with $3.18 billion at the end of the previous quarter. During the quarter, the company’s operating cash flow was $122.8 million. Further, the company repurchased shares worth $25 million during the quarter.
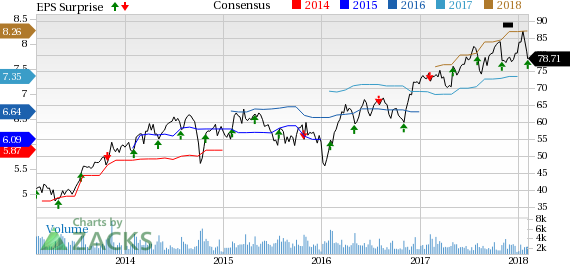
Arrow Electronics, Inc. Price, Consensus and EPS Surprise
Arrow Electronics, Inc. Price, Consensus and EPS Surprise | Arrow Electronics, Inc. Quote
Impact of Tax Rate
Management noted that its effective tax rate was 310 bps lower than the previously anticipated range of 27-29%, pertaining to certain “favorable tax rulings” which were not certain at the beginning of the quarter. The company enjoyed a benefit of $9 million in non-GAAP net income due to this change.
Management noted that per the new tax reforms, it will pay “approximately $196 million on taxes on our more than $3 billion of unremitted foreign earnings and increasing installments over the next eight years”. The positive impact of the new reforms will be recognized after eight years.
Full-Year Results
Arrow generated adjusted consolidated sales of $26.812 billion in 2017, reflecting an increase of 11.6% from the prior year.
Non-GAAP net income per share increased 13.6% from the previous year to $7.56.
Guidance
For the first quarter of 2018, sales are expected between $6.4 billion and $6.8 billion (mid-point $6.6 billion). The Zacks Consensus Estimate is pegged at $6.54 billion. Global components sales are projected in the range of $4.7-$4.9 billion. Global enterprise computing solutions sales are estimated to be in the range of $1.7-$1.9 billion.
The company projects non-GAAP earnings per share in the range of $1.74-$1.86 (mid-point $1.80 per share). The Zacks Consensus Estimate is pegged at $1.73 per share.
Bottom Line
The company reported better-than-expected fourth-quarter results backed by the addition of “new entrant, mid-market, and large-scale customers”. The company’s widened engagement with suppliers has attracted new clients.
Management is particularly optimistic about its digital team addressing the needs of the “entry-level market with self-service design”. Additionally, the acquisition of eInfochips has enriched its internal engineering abilities as well as made it proficient to meet larger engineering requirements. Moreover, management was overwhelmed with the growth in the semiconductor industry.
Furthermore, we believe, the company’s efforts toward gaining traction in the Internet of Things (IoT) space are positives. Over the past year, the company has made several partnerships with the likes of International Business Machines (NYSE:IBM) and Ingenu in a bid to enhance its IoT capabilities which will be beneficial for its financials going ahead.
Zacks Rank and Key Picks
Arrow carries a Zacks Rank #3 (Hold).
Two better-ranked stocks in the broader technology sector are Micron Technology, Inc. (NASDAQ:MU) and The Trade Desk Inc. (NASDAQ:TTD) , both sporting a Zacks Rank #1 (Strong Buy).
Long-term EPS growth rate for Micron and The Trade Desk are projected to be 10% and 25%, respectively.
You can see the complete list of today’s Zacks #1 Rank stocks here.
Zacks Top 10 Stocks for 2018
In addition to the stocks discussed above, would you like to know about our 10 finest buy-and-hold tickers for the entirety of 2018?
Last year's 2017 Zacks Top 10 Stocks portfolio produced double-digit winners, including FMC Corp (NYSE:FMC). and VMware which racked up stellar gains of +67.9% and +61%. Now a brand-new portfolio has been handpicked from over 4,000 companies covered by the Zacks Rank. Don’t miss your chance to get in on these long-term buys.
Access Zacks Top 10 Stocks for 2018 today >>
International Business Machines Corporation (IBM): Free Stock Analysis Report
The Trade Desk Inc. (TTD): Free Stock Analysis Report
Arrow Electronics, Inc. (ARW): Free Stock Analysis Report
Micron Technology, Inc. (MU): Free Stock Analysis Report
Original post
Zacks Investment Research