Few predict that a recession is imminent. On the flip side, how should one reconcile the fact that the treasury yield curve is flatter than it has been since 2007? A diminishing spread between 30s and 2s has a history of alerting market watchers to economic difficulties.
At the start of the current recovery in June of 2009, the spread between the longest-term maturities and shorter-term maturities clocked in at a relatively robust 3.5%. The yield curve was noticeably steep. Eight years later? The spread is down in the area of 1.3%.
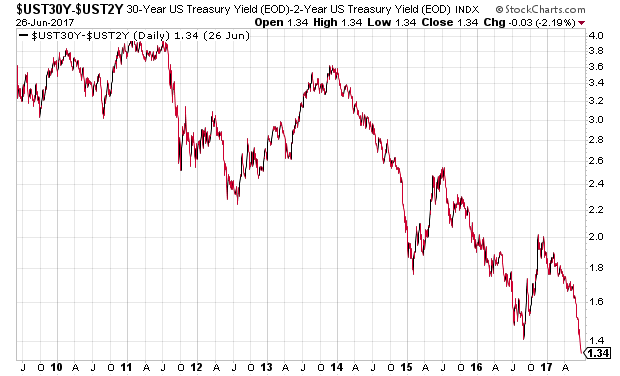
Granted, 1.3% does not represent yield curve inversion. That’s when the spread between key maturities falls below zero. What’s more, inversion preceded 7 of the last 7 recessions. (Note: As infallible as that may sound, the inversion between 30s and 2s came roughly 21 months before the 12/07-6/09 Great Recession.)
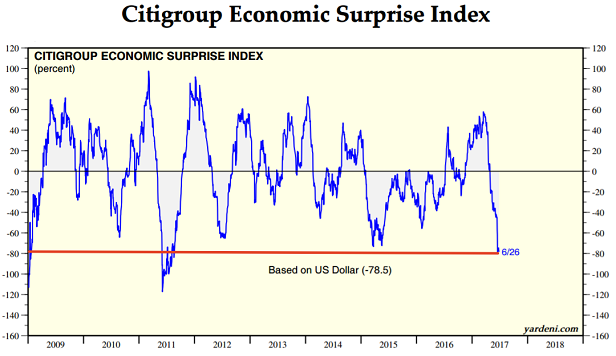
Nevertheless, the flattening of the yield curve makes it challenging to argue that economic growth is solid. On the contrary. Analyst expectations for key economic information have rarely missed as badly. In fact, you have to go back to the sovereign debt crisis in 2011 for similar levels of weakness in the hard data.
So what is the rationale for the Federal Reserve to tighten policy rates and push up borrowing costs on shorter-term lending rates? It cannot be a fear of wage growth overheating. After all, both the energy complex and retailers will be forced to let go of a significant portion of the labor force.
It cannot be economic acceleration, as annual GDP dipped from 2.6% in 2015 to 1.6% in 2016. Similarly, GDP in the first quarter of 2017 was only 1.2%. With a modest pickup in Q2, the country may be able to grow at its “same-old, same-old” sub-par annualized 1.9%-2.0% since 2009.
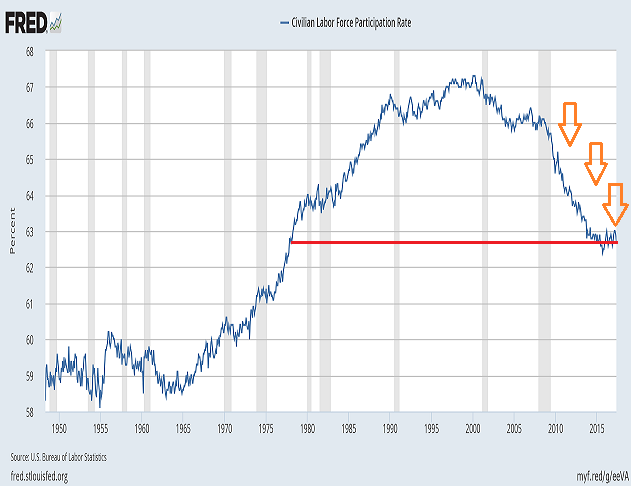
If neither the economy nor wage inflation are about to shift into higher gears, are Janet Yellen and her Fed colleagues simply expressing optimism on fuller employment? Please. They know quite well that if you do not count workers who stop looking for work altogether, one can manipulate ‘headline’ unemployment results. The truth is better represented by labor force participation — a 62.7% rate that is stuck in the 1970s.
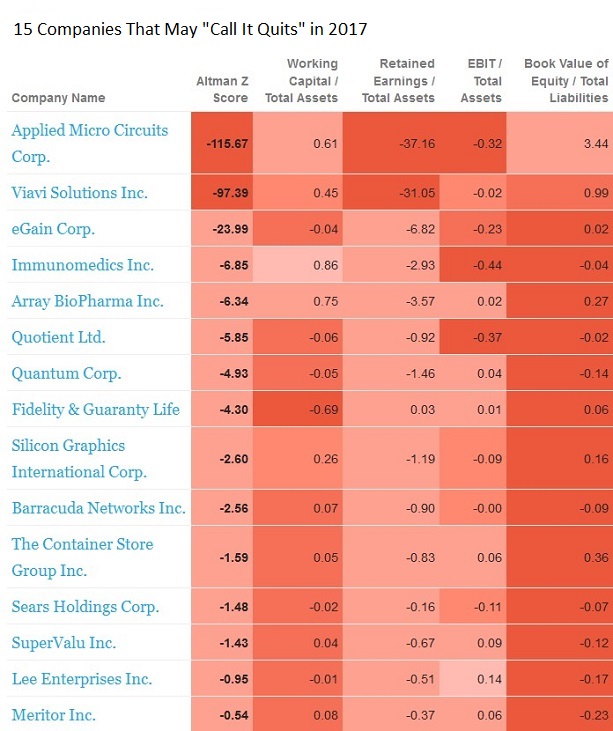
There are more headwinds. Both auto loan defaults and student loan defaults are rising. Corporate bankruptcies are also on an upswing. And for those who follow Altman’s Z-Score used to predict corporate bankruptcies, average Z-Scores are lower today than they were back in 2007. (Note: Lower scores imply a greater likelihood of distress.)
The Federal Reserve has been telling us for years that it bases its decisions on the data. And yet the data have not supported their monumental shift from ‘easy-money’ advocates to ‘tighten-the-rein’ mouthpieces.
A cynic might say that Fed members are being political. I’m not sure. Still, there is an awfully big coincidence in the policy shift occurring in conjunction with the election of Trump.
From my vantage point, I think the shift has more to do with trying to play catch-up. Federal Reserve members know that after eight years, a recession is extremely likely to arise in the not-too-distant future. The more that the Fed moves overnight lending rates away from the zero bound and the more that they reduce their balance sheet, the more ‘firepower’ they might have to return to conventional rate cutting and unconventional asset purchases.
Complacent investors may choose to take all of the above-mentioned information and interpretation in stride. Why worry? Be very happy with record stock prices.
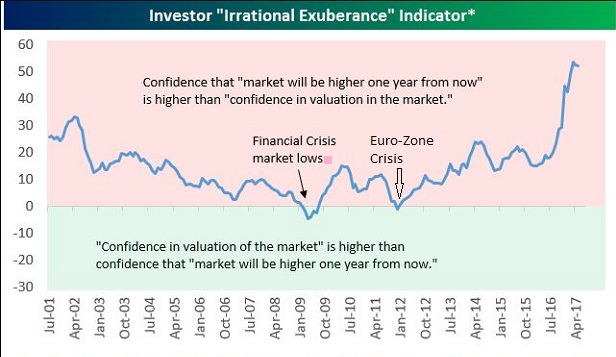
Unfortunately, excessive exuberance does not typically pan out in the investing arena. Consider Bespoke Investment Group’s Irrational Exuberance Indicator. According to Bespoke strategist George Pearkes, “When the resulting reading is negative, it means investors find the market’s valuation attractive but they don’t think the market is going to go up. When the resulting reading is high, it means investors expect the market to go up, but they don’t like the market’s valuation.”
The best time to be a buyer, of course, is when the indicator falls below zero. Huge buying opportunities at attractive prices occurred in the first quarter of 2009 and in the summer of 2011. Today? You might not find a more telling example of unbridled euphoria. (Buy, buy, buy! Or, reduce your exposure?)
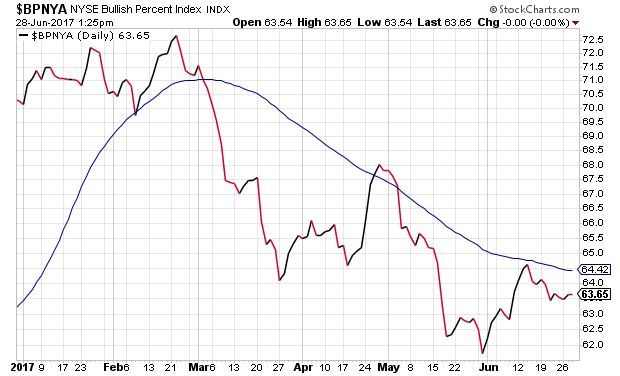
Another concern? Since the March peak, large-cap stock benchmarks have managed to tack on another 2% in price gains. However, fewer and fewer individual stocks trade in long-term uptrends; that is, fewer companies are trading above their 200-day moving averages, suggesting that market breadth continues to deteriorate.
Perhaps the most frequent comment from excited bulls who disagree with my cautionary stance — approx 50% stock for moderate growth-n-income clients, 25% investment grade debt and 25% cash equivalents — is my unwillingness to accept the unassailable benefits of low rates. Oh, I accept their influence in creating a wealth effect alright. What I don’t accept is the idea that ultra-low borrowing costs render stock valuations irrelevant.
To wit, the U.S. experienced 20 years of a very similar rate environment (i.e., 1935-1954). Yet today’s low rates are supporting price-to-earnings (P/E) and price-to-sales (P/S) ratios that are DOUBLE what they were back in those two decades. In that period, valuations were about HALF of what they are today, and not just on things like profits and revenue. Tobin’s Q? Buffett’s Market-Cap-to-GDP? Both of those heralded valuation measures imply stocks would need to fall as much as 50%, just to bring valuations back to the 1935-1954 mean.
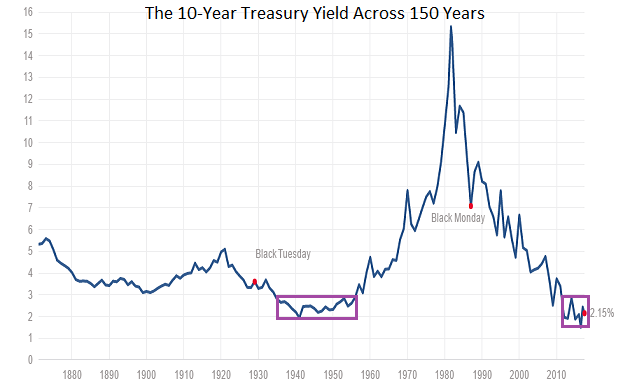
Perhaps more importantly, low rates did not terminate bear market price depreciation in those 20 years. Bears occurred in 1937-1938 (-49.1%), 1938-1939 (-23.3%), 1939-1942 (-40.4%) and 1946-1947 (-23.2%). Keep in mind, history tends to blame the 1937-1938 mauling on Fed policy error (i.e., ill-advised tightening.).
It is true that I went on the record in 2010, expressing dissatisfaction for a second round (QE2) of electronic money printing to buy bonds. QE1? It was necessary to stop the financial crisis and credit crunch, even though the Fed itself created the conditions for the housing bubble/subprime. Yet stimulus for years and years thereafter?
Reflated asset prices forged a wealth effect. I know I feel a whole lot wealthier. Yet the wealth effect did very little (if anything) for economic growth and wage inflation.
I have said it before and I will say it again: The global central bank cartel that controls both the access to money and the cost of money represents a tyranny of good intentions. The hope that a massive asset rally (e.g., stocks, bonds, real estate, etc.) would encourage or find its way into economic growth and wage growth never quite materialized.
What will materialize? The asset boom will eventually become an asset blunder. Booms that have little rationale in the fundamentals eventually turn downward.
It follows that the question each investor will need to answer is, “Do my prospects for reward adequately compensate me for the genuine risk of financial loss?” If you’re like me, and you determine that the potential for reward does not adequately compensate you for the real possibility of substantial financial loss, then trim your allocation to higher-risk assets.
Disclosure Statement: ETF Expert is a web log (“blog”) that makes the world of ETFs easier to understand. Gary Gordon, MS, CFP is the president of Pacific Park Financial, Inc., a Registered Investment Adviser with the SEC. Gary Gordon, Pacific Park Financial, Inc., and/or its clients may hold positions in the ETFs, mutual funds, and/or any investment asset mentioned above. The commentary does not constitute individualized investment advice. The opinions offered herein are not personalized recommendations to buy, sell or hold securities. At times, issuers of exchange-traded products compensate Pacific Park Financial, Inc. or its subsidiaries for advertising at the ETF Expert website. ETF Expert content is created independently of any advertising relationship.
