
Applied Materials Inc. (NASDAQ:AMAT) reported robust fiscal second-quarter 2019 results, with both the top and bottom lines surpassing the Zacks Consensus Estimate.
The company’s pro-forma earnings per share (EPS) of 70 cents beat the consensus mark by 4 cents and came in within the guided range of 62-70 cents. However, the bottom line was down 42.6% year over year and 13.6% sequentially.
Revenues of $3.54 billion surpassed the Zacks Consensus Estimate of $3.48 billion and were within the guided range of $3.33-$3.63 billion.
However, the top line decreased 5.7% sequentially and 22.7% year over year.
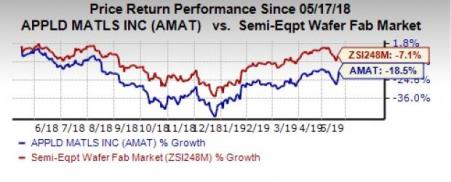
Following strong fiscal second-quarter results, its share price increased 6.10%. However, shares have lost 18.5% in the past year compared with its industry’s decline of 7.1%.
Management expects inventory levels to normalize in the near term, creating a favorable environment for capacity investments in 2020. In foundry logic, management expects spending to be up year over year.
However, management continues to expect overall wafer fab equipment spending in 2019 to be down mid to high-teens.
Also, management expects 2019 display revenues to decline from a year ago as customers push out investments. However, the company is positive about the display market over the long term as it is becoming more technology intensive and increasingly dependent on materials innovation. Moreover, Mobile OLEDs and large screen televisions are opening new market opportunities for Applied Materials.
The company sees significant opportunities from emerging trends on the semiconductor and display fronts such as artificial intelligence, big data, cloud infrastructure, Internet of Things (IoT), virtual reality and smart vehicles.
We believe that Applied Materials is in a great position to grow sustainably and profitably, based on its strong pipeline of enabling technologies, supported by expanding opportunities on the semiconductor, service and display fronts.
Let’s delve deeper into the numbers.
Revenues by Segment
The Semiconductor Systems Group (SSG) contributed 62% to its total revenues, reflecting a decrease of 3.7% sequentially and 24.7% year over year.
Applied Global Services (AGS) was the second-largest contributor with 28% revenue share. The segment’s revenues increased 2.3% sequentially and 4.1% from the prior-year quarter.
Revenues from the Display segment, accounting for 10% of the total revenues, were down 31.4% sequentially and 51.6% from the year-ago level.
Revenues by Geography
China contributed 28%, Taiwan 22%, Japan 15%, United States 13%, Korea 12%, Europe 6% and Southeast Asia 3% to the total revenues.
United States and Taiwan increased both on a sequential and year-over-year basis. All other countries, except China and Japan, decreased on a sequential and year-over-year basis. China increased on a sequential basis and Japan was up 3.6% from the year-ago quarter.
Operating Results
Pro-forma gross margin was 43.5%, down 240 basis points (bps) from the year-ago quarter.
Applied Materials’ operating expenses of $754 million decreased 1.3% from the year-ago quarter.
Pro-forma operating margin of 22.4% decreased 690 bps year over year.
Balance Sheet
At the end of the fiscal second quarter, inventories were $3.68 billion versus $3.72 billion in the prior quarter. Accounts receivables decreased to $2.26 billion from $2.44 billion in the fiscal first quarter. Cash and cash equivalent balance was $3.11 billion compared with $3.19 billion in the fiscal first quarter.
The company returned $625 million and $189 million through stock repurchases and cash dividends, respectively.
Guidance
Applied Materials provided guidance for the third quarter of fiscal 2019. Revenues are expected to be $3.525 billion (+/-$150 million). The Zacks Consensus Estimate for the same is pegged at $3.57 billion.
Non-GAAP EPS is expected in the range of 67-75 cents. The corresponding Zacks Consensus Estimate is pegged at 70 cents per share.
Applied Materials, Inc. Price, Consensus and EPS Surprise
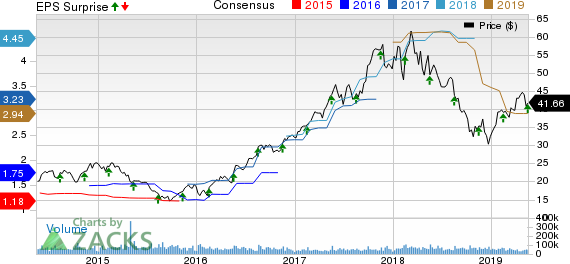
Applied Materials, Inc. price-consensus-eps-surprise-chart | Applied Materials, Inc. Quote
Zacks Rank and Stocks to Consider
Currently, Applied Materials carries a Zacks Rank #3 (Hold). Some better-ranked stocks in the broader technology sector include Facebook, Inc. (NASDAQ:FB) , IAC/InterActiveCorp (NASDAQ:IAC) and AXT, Inc. (NASDAQ:AXTI) , each carrying a Zacks Rank #2 (Buy). You can see the complete list of today’s Zacks #1 Rank (Strong Buy) stocks here.
Long-term earnings growth for Facebook, IAC/InterActiveCorp and AXT is currently projected at 20.2%, 20.5% and 15%, respectively.
Breakout Biotech Stocks with Triple-Digit Profit Potential
The biotech sector is projected to surge beyond $775 billion by 2024 as scientists develop treatments for thousands of diseases. They’re also finding ways to edit the human genome to literally erase our vulnerability to these diseases.
Zacks has just released Century of Biology: 7 Biotech Stocks to Buy Right Now to help investors profit from 7 stocks poised for outperformance. Our recent biotech recommendations have produced gains of +98%, +119% and +164% in as little as 1 month. The stocks in this report could perform even better.
IAC/InterActiveCorp (IAC): Free Stock Analysis Report
Facebook, Inc. (FB): Free Stock Analysis Report
AXT Inc (AXTI): Free Stock Analysis Report
Applied Materials, Inc. (AMAT): Free Stock Analysis Report
Original post
Zacks Investment Research