
Applied Materials Inc. (NASDAQ:AMAT) reported robust first-quarter fiscal 2018 results, with both the top and the bottom lines surpassing the Zacks Consensus Estimate.
The company’s pro forma earnings per share (EPS) of $1.06 beat the consensus mark by 9 cents and came on the higher end of the guided range of 94 cents to $1.02 per share. Earnings were up 14% sequentially and 59% year over year.
Revenues of $4.2 billion beat the consensus mark by $101 million and were within the guided range of $4-$4.2 billion. Revenues increased 5.9% sequentially and 28.2% year over year. The revenue growth was backed by higher demand in most of the regions.
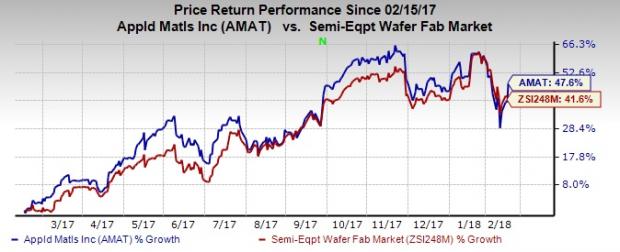
Following the strong fiscal first-quarter results, the company’s share price increased 4.86%. Shares have increased 47.7% in the last 12 months, outperforming the industry’s gain of 41.6%.
Inflection-focused innovation strategy was the primary growth driver. The company continues to witness technological advancements in semiconductor and flat-panel display areas. 3D NAND, DRAM and patterning have led to significant market share gains.
Applied Materials has well-differentiated products and high market share in foundry and logic. It is significantly improving on its memory market share as well. Management expects robust double-digit growth in semiconductor, display and service businesses in 2018. It expects wafer fab equipment (WFE) market’s combined spending in 2018 and 2019 to reach around $100 billion.
Applied Materials remains strongly positioned in China where it continues to witness robust growth in semiconductor and display. Growing investments from Chinese domestic manufacturers have been the main catalysts.
Notably, the company has gained considerable success in expanding beyond semiconductors, particularly in display. Mobile OLEDs and large screen televisions are opening new market opportunities for Applied Materials.
Applied Materials sees significant opportunities from emerging trends on the semiconductor and display fronts such as artificial intelligence, big data, cloud infrastructure, Internet of Things (IoT), virtual reality and smart vehicles.
We believe that Applied Materials is in a great position to grow sustainably and profitably based on its strong pipeline of enabling technologies, supported by expanding opportunities on the semiconductor, service and display fronts.
Let’s delve deeper into the numbers.
Revenues by Segment
The Semiconductor Systems Group (SSG) contributed 67.7% of revenues, reflecting an increase of 17.1% sequentially and 32.4% year over year.
The second-largest contributor was Applied Global Services (AGS) with 20.9% revenues share. Segment revenues increased 5.9% sequentially and 30.2% from the prior-year quarter.
The Display segment was down 32.8% from the last quarter but up 7.8% from the year-ago level, contributing 10.8% to revenues.
Revenues by Geography
Korea contributed 29% to revenues, China 22%, Taiwan 18%, Japan 11%, United States 9%, Europe 6% while Southeast Asia 4%.
On a sequential basis, Southeast Asia, United States and Japan were the weakest, declining 43.9%, 10.6%, and 5.1% respectively. All the other regions improved sequentially.
On a year-over-year basis, only Taiwan decreased 31.5%. All the other regions increased.
Margins
Pro forma gross margin was 46.7%, up 50 basis points (bps) sequentially and 130 bps from the year-ago quarter.
Applied Materials’ operating expenses of $724 million increased 5% sequentially and 14% from the year-ago quarter. Operating margin of 29.6% increased 90 bps sequentially and 360 bps year over year.
Net Profit
On a pro-forma basis, Applied Materials reported net income of $1.1 billion or $1.06 per share compared with $1 million or 93 cents in the prior quarter. In the year-ago quarter, Applied Materials had reported net income of $732 million or 67 cents per share.
Our pro-forma calculation excludes restructuring, acquisition-related, impairment and other charges as well as tax adjustments in the reported quarter.
On a GAAP basis, the company registered net profit of $135 million (13 cents per share) compared with $982 million (91 cents per share) in the previous quarter and $703 million (65 cents per share) a year ago.
Balance Sheet
At the end of fiscal first quarter, inventories increased to $3.13 billion from $2.93 billion in the previous quarter. Accounts receivables decreased to $2.18 billion from $2.34 in the prior quarter. Cash and cash equivalents balance was $6.8 billion compared with $5.01 billion in the prior quarter.
The company generated $1.47 billion in cash from operations. The company spent $203 million on capex and returned $782 and $106 million through stock repurchases and cash dividends, respectively.
Dividend/ Share Repurchase
During the fiscal first quarter, the company increased its quarterly cash dividend to 20 cents per share. Also, the Board approved a new $6.0 billion share repurchase authorization. This new authorization is incremental to $2.8 billion remaining in the previously approved authorization.
Guidance
Applied Materials also provided guidance for the second quarter of fiscal 2018. Revenues are expected between $4.35 and $4.55 billion, up 26% year over year. The guidance is also better than the Zacks Consensus Estimate of $4.16 billion. Non-GAAP EPS is expected to come in the range of $1.10-$1.18 per share, above the consensus mark of 99 cents.
Applied Materials, Inc. Price, Consensus and EPS Surprise
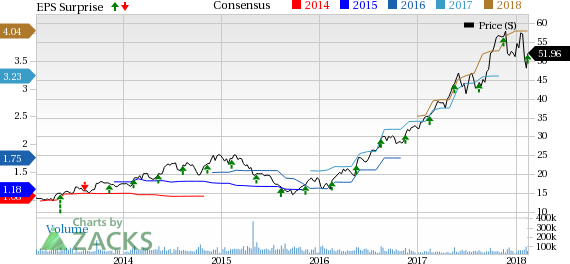
Applied Materials, Inc. Price, Consensus and EPS Surprise | Applied Materials, Inc. Quote
Zacks Rank and Stocks to Consider
Applied Materials carries a Zacks Rank #3 (Hold). A few better-ranked stocks in the technology sector are PetMed Express (NASDAQ:PETS) , Teradyne (NYSE:TER) and Mercadolibre (NASDAQ:MELI) . While PetMed and Teradyne sport a Zacks Rank #1 (Strong Buy), Mercadolibre carries a Zacks Rank #2 (Buy). You can see the complete list of today’s Zacks #1 Rank stocks here.
Long-term earnings per share growth rate for PetMed, Teradyne and Mercadolibre is projected to be 10%, 12% and 25%, respectively.
The Hottest Tech Mega-Trend of All
Last year, it generated $8 billion in global revenues. By 2020, it's predicted to blast through the roof to $47 billion. Famed investor Mark Cuban says it will produce ""the world's first trillionaires,"" but that should still leave plenty of money for regular investors who make the right trades early.
See Zacks' 3 Best Stocks to Play This Trend >>
PetMed Express, Inc. (PETS): Free Stock Analysis Report
MercadoLibre, Inc. (MELI): Free Stock Analysis Report
Applied Materials, Inc. (AMAT): Free Stock Analysis Report
Teradyne, Inc. (TER): Free Stock Analysis Report
Original post
Zacks Investment Research