For 3 years beginning in 2009 Apple (AAPL) trended within a buying channel, until price broke out in 2012 and started going somewhat parabolic. Parabolic moves, where price goes too far too fast, tend to get back-filled, a test to gauge buying interest. The ensuing correction initially found support at the upper channel but eventually broke through the other end and is now in a throwback to the lower channel line.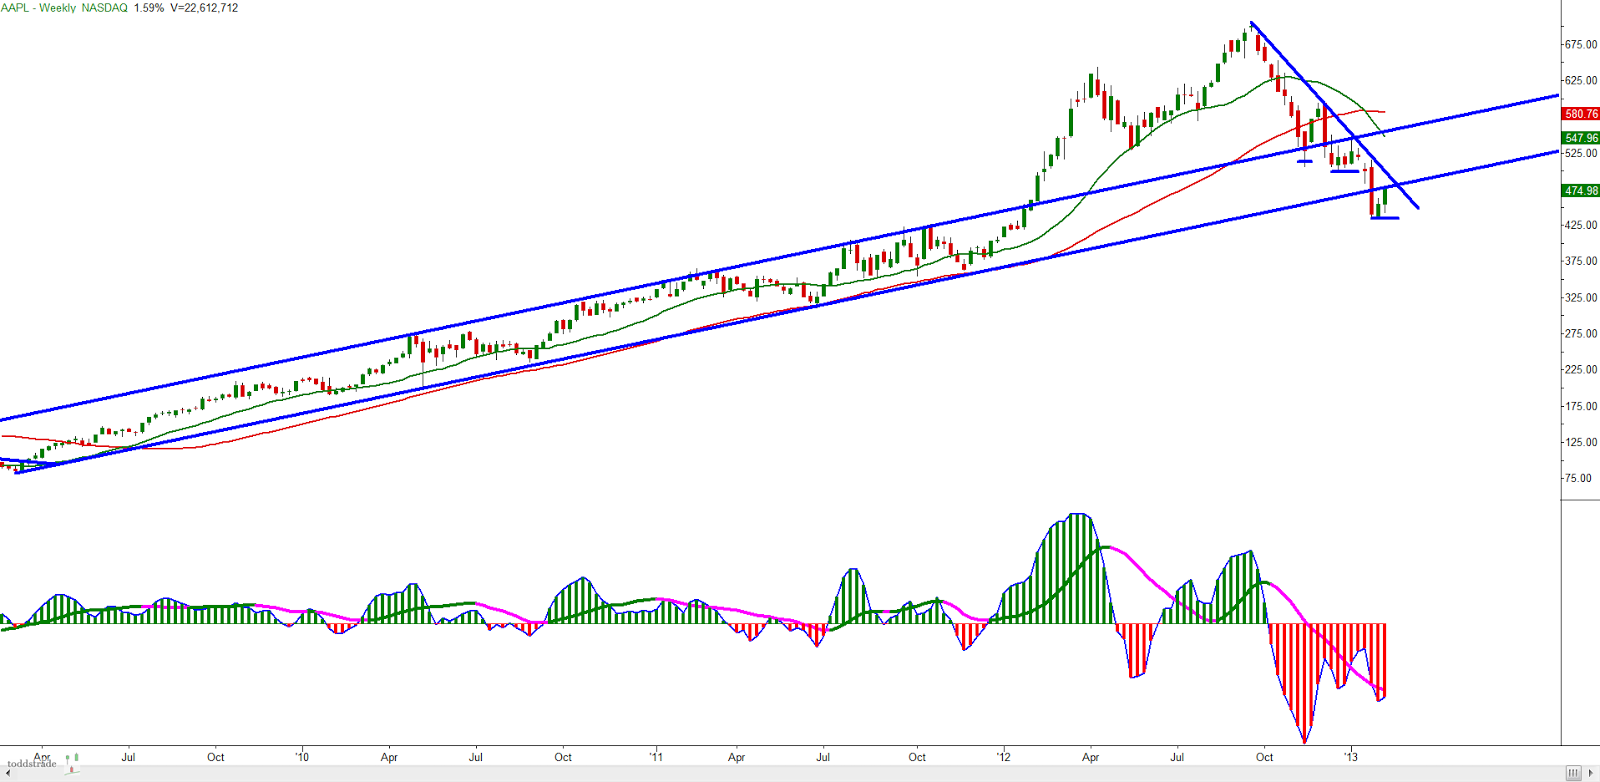
It would make sense to incorporate a higher time frame perspective with an equity that has been in a bull market really since 2004. So, looking at a monthly (log) chart we can put the most recent corrective phase into perspective.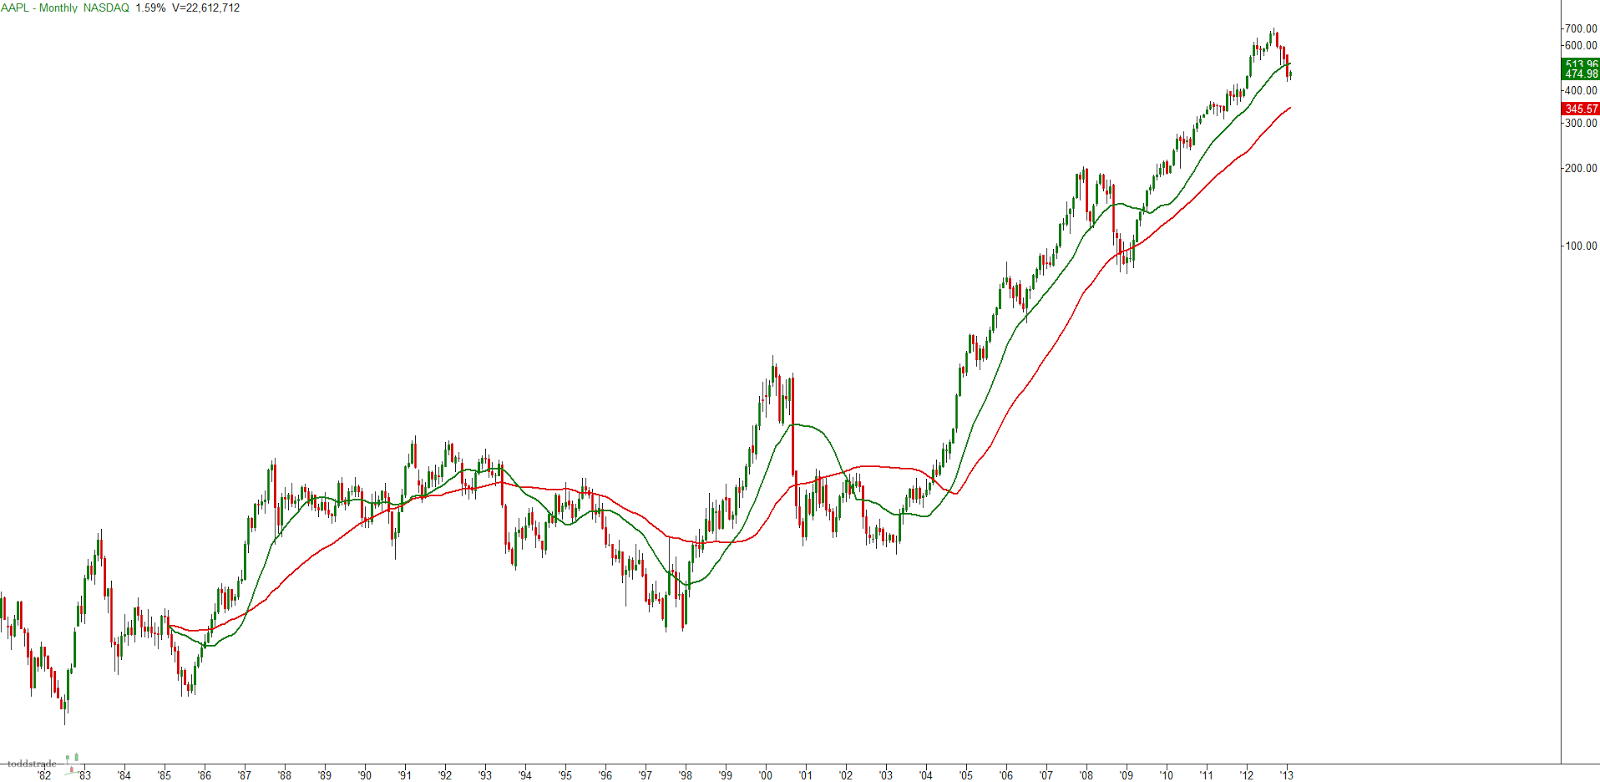
So, though AAPL is in a long-term bull market, it is also (still) in a corrective phase on a faster time frame, and a market can correct longer than most can remain solvent trying to catch the bottom.
Using multiple time frames:
Below is a monthly chart on the left paired with a weekly chart on the right.
Monthly showing bullish trend still intact while the 3/10macd is showing 2c criteria. With the slow line still very much positive we eventually anticipate the fast line to start ticking up (2d criteria). Whether or not price will continue with its bullish trend is too soon to tell.
The setup I like to look for with the 2c-2d criteria is the 3d criteria on the faster time frame. So in this case we're looking for the weekly slow line to start turning up while both the fast and slow lines start progressing towards the zero-line (still at least a few weeks off)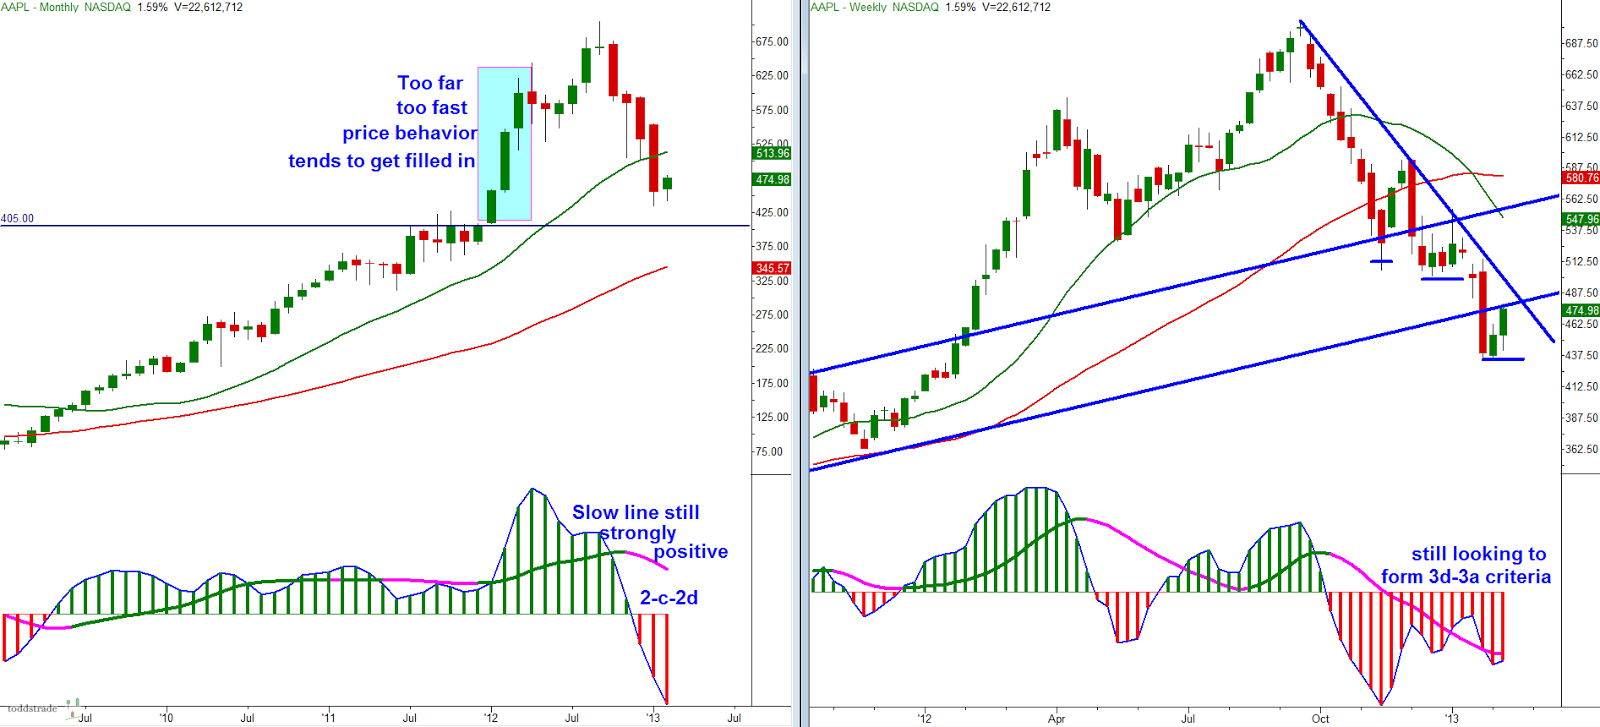
Below is an example of the 2c-2d criteria back in 2008. However, the weekly time frame never did set up the 3d criteria, rather we saw 3a criteria with very eager buyers (very little pullback). Eventually price rolled over and it was in 2009 we saw the weekly 3d set up with a much more constructive bottoming process (3-push price pattern)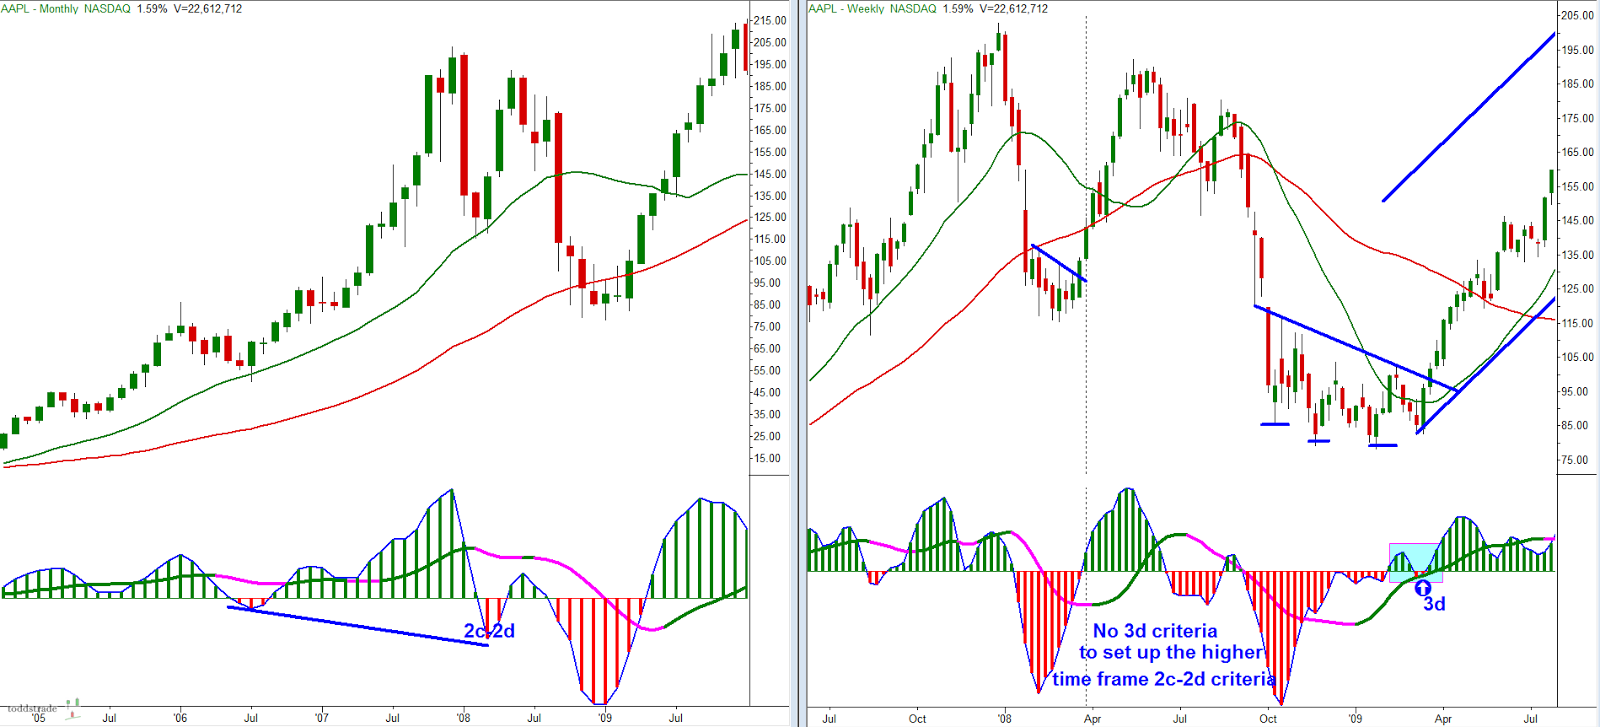
Back to the current environment. We can expect the monthly 3/10macd fast line to start ticking Up when the faster time frame (weekly) begins to heal (where the fast and slow line start ticking up 3d, 3a criteria).
We can anticipate the healing of the weekly macd by looking at what the daily is doing.
Below, right is the daily, showing the obvious bear trend still intact (though many seem to be very anxious to call a bottom). Price is pulling into the down-trending 20-MA (criteria 3a). The slow line is still very negative and quite far from the zero line which means it will take either a decent amount of time or momentum to pull this slow line higher. Even if we were to see strong momentum which would help pull the slow line closer to zero it would still be more prudent to wait for a higher low pullback.
(I threw in a modified pitchfork because it framed the daily price behavior pretty well.)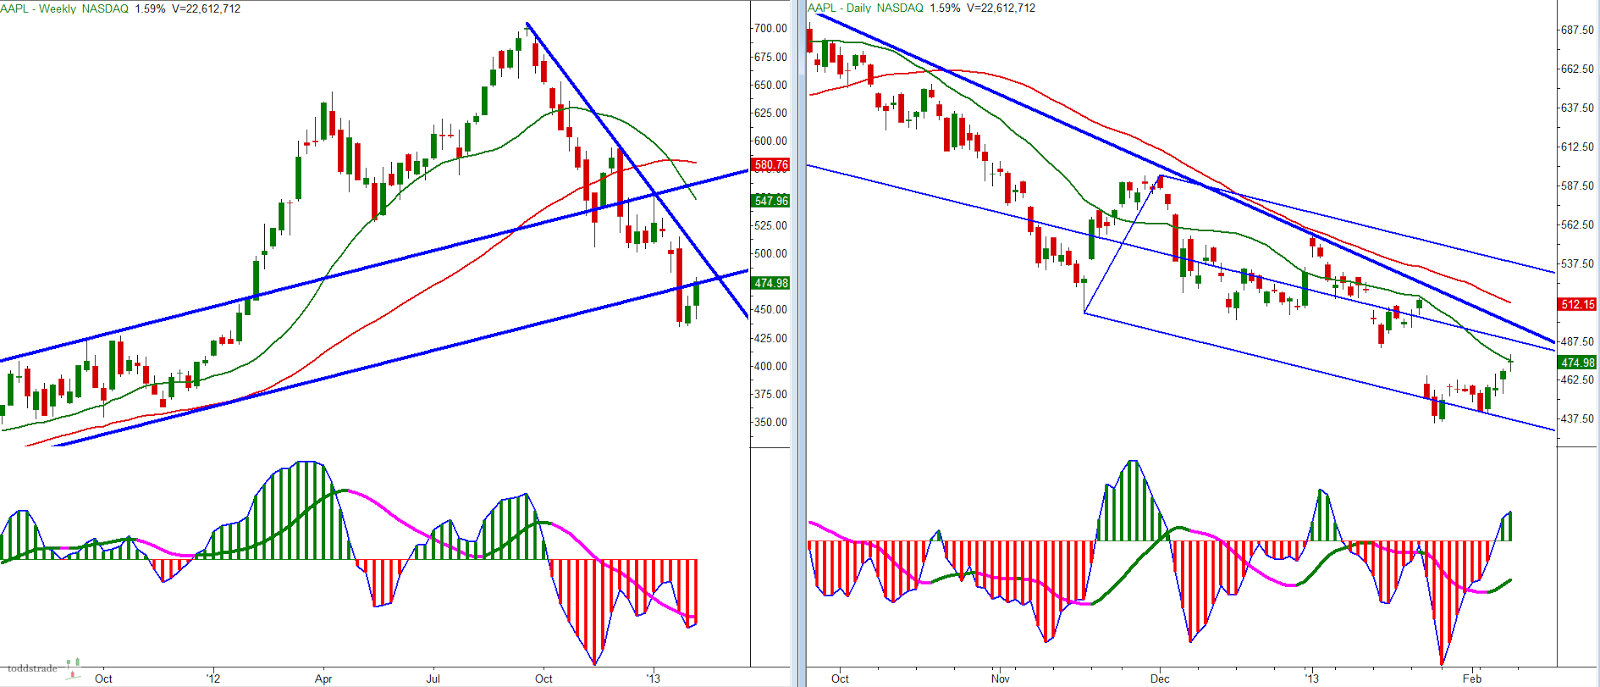
If I were looking to buy the anticipation of the weekly macd turning up, then I would be waiting for the daily 3/10macd to pull back THEN tick Up, ideally looking something like this: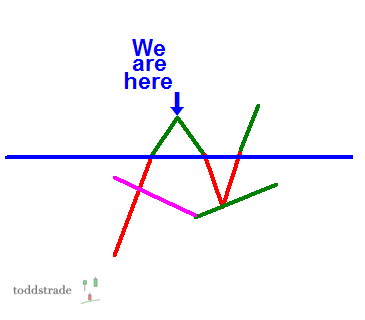
To summarize:
The higher time frame monthly is still bullish, but in a corrective phase. It's 3/10macd fast line looks as though it may begin ticking up, but this is a monthly chart and a bullish continuation wouldn't be validated until we saw criteria 1a (or, more than likely 2a, the "a" is what is important, which is just saying that the fast line is back to positive) on this time frame, which would take a few MONTHS.
We can anticipate this by looking to the weekly where we would like to see bullish development in the 3/10macd (i.e. more GREEN). A slow line trending UP and eventually going positive and a fast line that goes, and remains, positive. Judging by the looks of the current weekly 3/10macd this may take at least a few of weeks
So, while the twittOsphere is a-buzz with those hunting for a bottom in AAPL the faster (daily) time frame still remains in a downward trending trajectory and (in my opinion) a buyable opportunity has yet to present itself. Things may begin to heal once this Daily 3/10macd begins to build a bullish bias, which will in turn improve the weekly 3/10 macd, which in turn will give us an idea if the monthly will remain in a bullish trend.
The only thing I can think of to compare it to would be the price structure of Gold, which has also been in a bull market for nearly 10-years now and shows similar 3/10macd characteristics (AAPL on the left, Gold on the right below)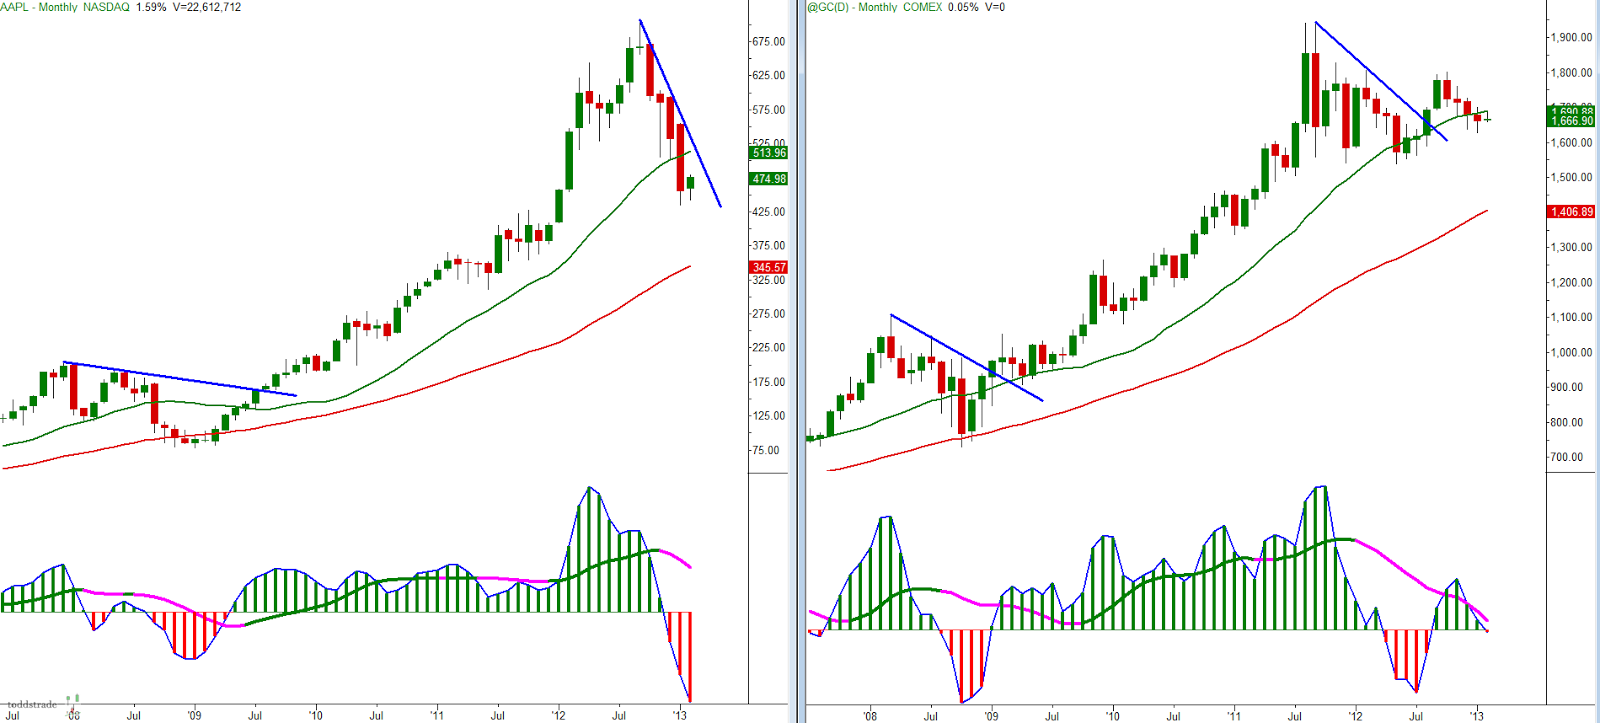
Here is how the 2c-2d criteria on the monthly time frame set up on the weekly. Currently things look they can go either way from here. A breakout of the overhead trend line could end up turning the monthly 3/10macd fast line higher. While a failure of support could bring momentum in to the downside and turn into a much larger correction.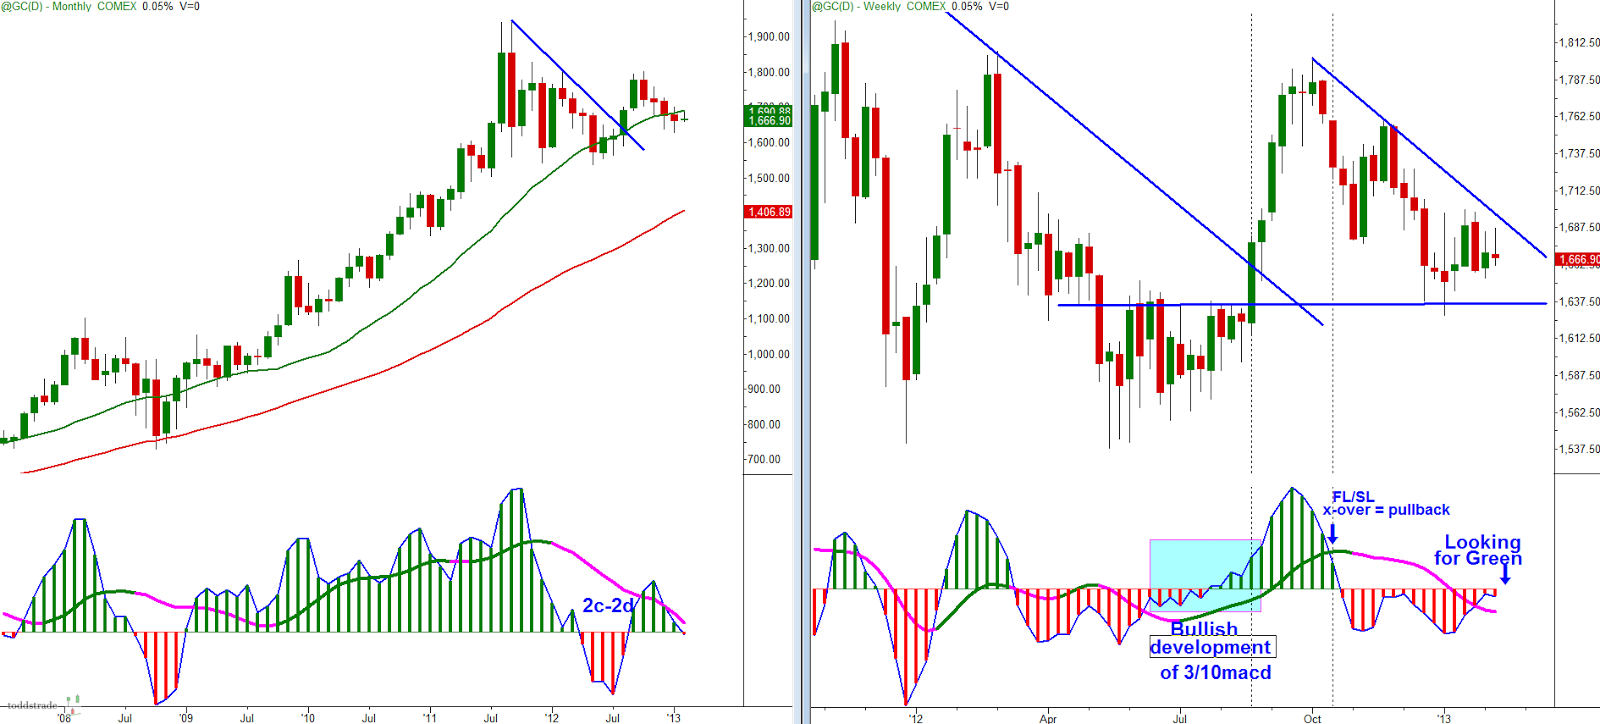
- English (UK)
- English (India)
- English (Canada)
- English (Australia)
- English (South Africa)
- English (Philippines)
- English (Nigeria)
- Deutsch
- Español (España)
- Español (México)
- Français
- Italiano
- Nederlands
- Português (Portugal)
- Polski
- Português (Brasil)
- Русский
- Türkçe
- العربية
- Ελληνικά
- Svenska
- Suomi
- עברית
- 日本語
- 한국어
- 简体中文
- 繁體中文
- Bahasa Indonesia
- Bahasa Melayu
- ไทย
- Tiếng Việt
- हिंदी
Apple Still In A Corrective Phase
Published 02/08/2013, 05:54 PM
Updated 07/09/2023, 06:31 AM
Apple Still In A Corrective Phase
Latest comments
Loading next article…
Install Our App
Risk Disclosure: Trading in financial instruments and/or cryptocurrencies involves high risks including the risk of losing some, or all, of your investment amount, and may not be suitable for all investors. Prices of cryptocurrencies are extremely volatile and may be affected by external factors such as financial, regulatory or political events. Trading on margin increases the financial risks.
Before deciding to trade in financial instrument or cryptocurrencies you should be fully informed of the risks and costs associated with trading the financial markets, carefully consider your investment objectives, level of experience, and risk appetite, and seek professional advice where needed.
Fusion Media would like to remind you that the data contained in this website is not necessarily real-time nor accurate. The data and prices on the website are not necessarily provided by any market or exchange, but may be provided by market makers, and so prices may not be accurate and may differ from the actual price at any given market, meaning prices are indicative and not appropriate for trading purposes. Fusion Media and any provider of the data contained in this website will not accept liability for any loss or damage as a result of your trading, or your reliance on the information contained within this website.
It is prohibited to use, store, reproduce, display, modify, transmit or distribute the data contained in this website without the explicit prior written permission of Fusion Media and/or the data provider. All intellectual property rights are reserved by the providers and/or the exchange providing the data contained in this website.
Fusion Media may be compensated by the advertisers that appear on the website, based on your interaction with the advertisements or advertisers.
© 2007-2024 - Fusion Media Limited. All Rights Reserved.
