And the Market cheers Central Banks, Big Earnings and the First Snow…
While October snowflakes were finally hitting our Rocky Mountains last week, the European and Chinese Central Banks went bear hunting. Mario Draghi pulled out the big guns and crushed the euro by 3% on talks of further accommodation while the Chinese lowered interest rates and reserve requirements. Throw in a winning trifecta of Amazon (O:AMZN), Microsoft (O:MSFT) and Google (O:GOOGL) earnings beats and the week ended with a free showing of “Cloudy with a Chance of Bear-Meatballs.” The S&P 500 has now moved 10%+ off of its end of September lows and stocks have returned to take the performance lead from bonds for 2015.
The next move is up to the U.S. Federal Reserve. The market is betting on no move this week and continued falling oil and commodity prices are not giving the FOMC a reason to start liftoff. In addition, company specific issues continue to blast holes in individual stocks (especially in the area of health care), which has some investors on edge. Earnings are still coming at the market in a heavy flow this week, so there are many more data points to digest. So far, touching the Cloud while avoiding China, Energy and Wal-Mart (N:WMT) have been a good recipe for a higher move after earnings.
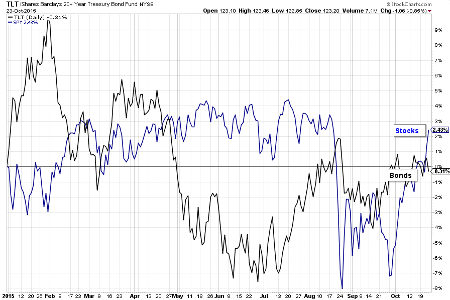
Here is the race between Stocks and Long Bonds (N:TLT) on a price basis. Note the much greater volatility in Bonds (range of +9.5% to -7.5%)…
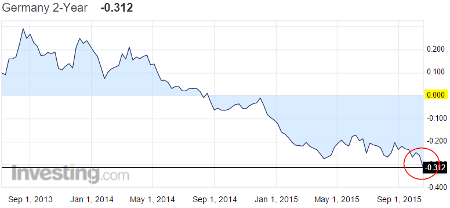
Mario and the ECB’s impact on short German yields is nothing short of awesome and led to a euro bloodbath last week…
Of course, all of this Government stimulus will someday come to an end. RenMac sees some signs that we should all pay attention to…

(Jeff deGraaf, Renaissance Macro Research)
And in the 3rd week of October, U.S. Corporate earnings finally put some fastballs across the plate…
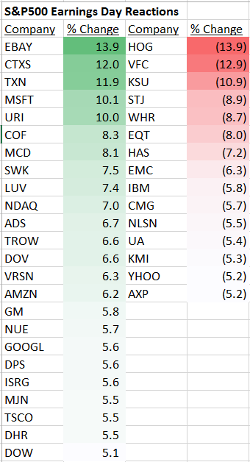
Here is a list of the 5%+ post earnings stock reactions for the S&P 500 last week. (I left off the O:KLAC buyout by O:LRCX.) Amazon, Microsoft and Google were the ones most talked about on Friday, but still plenty of other good receptions in other areas of the market.
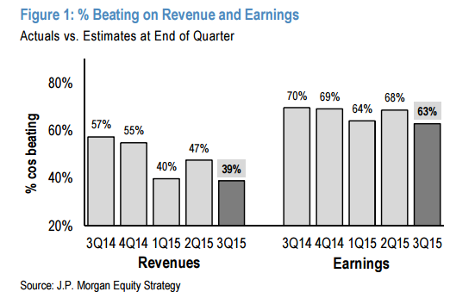
For the Quarter to date, companies are still behind trend in Revenue and Earnings beats, but it did get better last week…
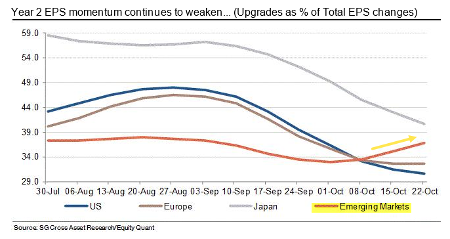
If you are looking for Earnings momentum, then SocGen would suggest you forget the Developed Markets…
A few Earnings comments that I found interesting this week:
1) “what really changed during the quarter was order entry levels weakened more than we anticipated and September was much more worse than we had expected… September is always a key month… it’s a really good indicator for what the rest of the year potentially is going to look like.” — Parker Hannifin (Industrial Equipment)
2) “We saw parts of the U.S. economy soften further, notably in the manufacturing sector.” —Manpower (Temp Staffing)
3) “I for one have a concern that we may find ourselves set [ph] into another downturn before we see the economy strengthen a great deal again, I mean. So we’re trying to be very careful.” —Zion (Bank)
(Avondale)
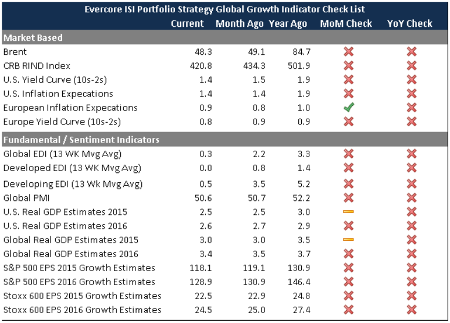
Helping the Global Central Banks to decide their degree of easing or no lift-off…
@NickatFP: Almost All Growth Indicators Still Declining
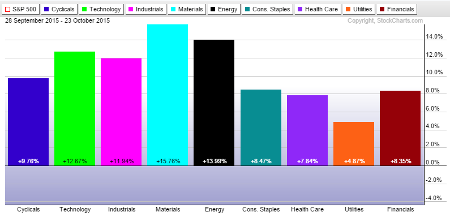
Now for a look at Sector performance from the end of a September low…
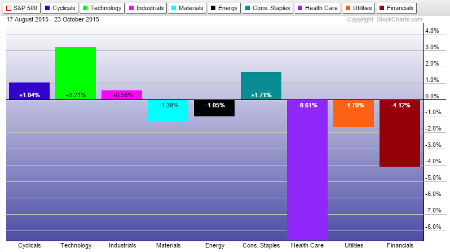
…and to compare it to the performance from before the August cliff dive…
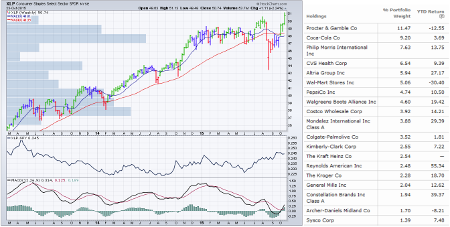
Consumer Staples (N:XLP) was the first Sector to make all-time new Highs last week. A deeper dive into its components…
So many investors (and Central Governments) would like Energy (N:XLE) equities to work from here, but can they in the face of falling oil and NatGas prices?
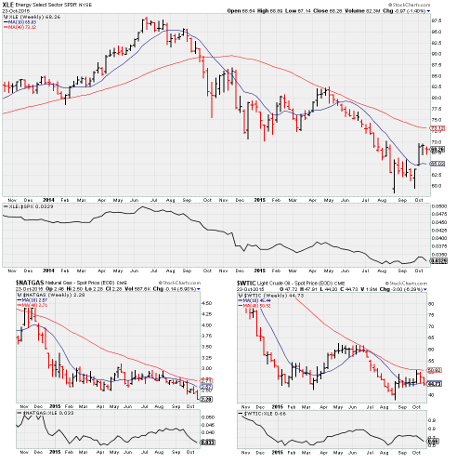
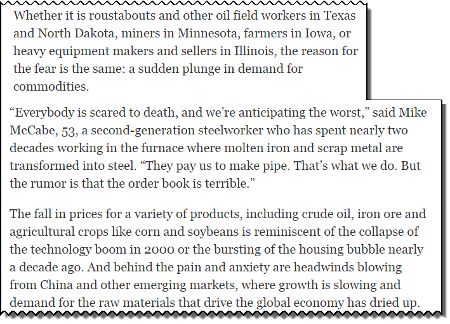
As prices decline, U.S. production is falling quickly, leading to empty pipelines…
The oil price downturn has put an end to the pipeline construction boom spurred in recent years by shale production, and midstream companies are struggling to keep products flowing through their systems. As the flood of oil flowing from new shale wells across the U.S. slows, so too has the need for pipelines to carry it. Companies that were once laying and welding pipe as fast as possible are now shelving plans for new pipelines and competing to fill the capacity due to come online soon. “Instead of pipelines full and producers competing for space, you have pipelines empty and competing for producers,” said John Auers, an analyst at Dallas consulting firm Turner Mason & Co.
Falling commodity prices are tricky for many parts of the U.S. economy, not just the Energy industry…
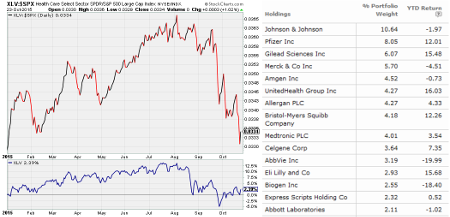
An even sharper decline in valuations has been seen in the Healthcare (N:XLV) industry, where concerns over drug prices and company specific items have erased premium valuations…
One widely owned high flyer, Valeant (N:VRX), has quickly erased a 10 month +125% move in 2.5 months…

Of course, given its enormous past performance, it is held in size by the hedge fund community…
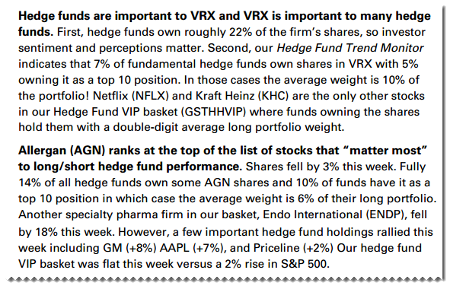
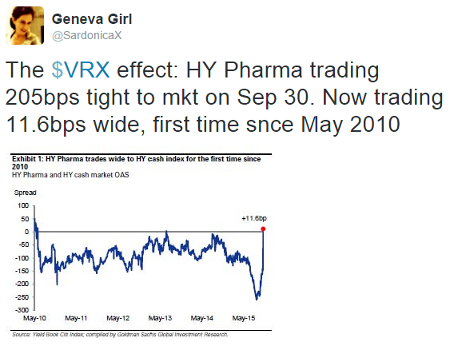
The bond market always knows first…
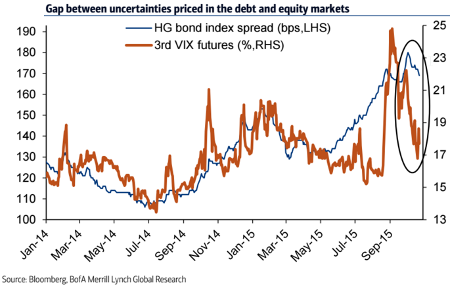
Speaking of Bonds, there appears to be a discrepancy between High Yield Bond spreads and Equity Volatility…
So the question is, will Bond spreads fall or will Equity volatility rise?
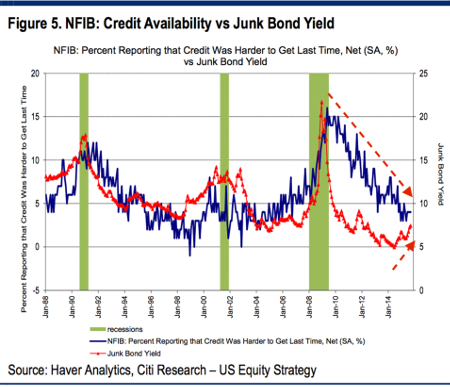
The world is watching the Availability of Credit closely now to see if the Junk Bond (N:JNK) market is trying to signal a concern…
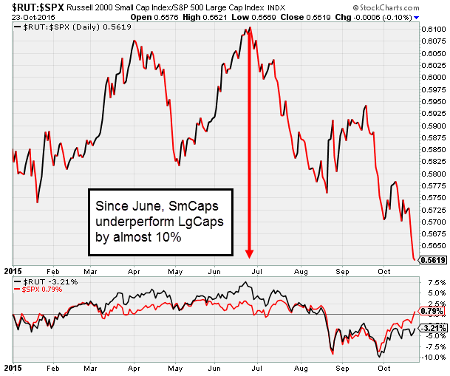
For pure Equity investors, the underperformance of Small Caps is a top concern…
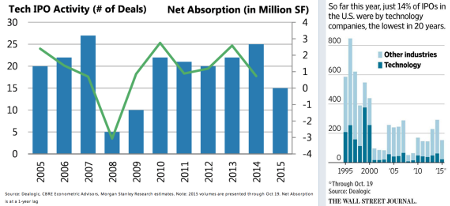
If you are about to sign a lease in Silicon Valley, ask for more concessions or lower prices…
Robust demand since the Great Recession is being called into question, with a pick up in sub-leasing earlier this year, weakness in our AlphaWise survey earlier this week, and a tech IPO slowdown now in the spotlight. Office absorption indeed tracks the IPO market over time, although we see mitigating factors such as strong pre-leasing of new space, constraints on future development, and vacancy still close to historic lows.
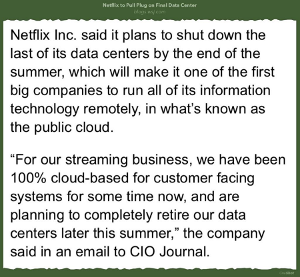
Tech companies with Cloud businesses crushed it last week. This trend is the Cloud’s friend…
@SuB8u: Netflix (O:NFLX) to soon run entirely off the cloud. Take that CIOs of traditional companies.
@jfahmy:
Charlie Brown: Why do I keep losing money?
Lucy: Because you keep shorting AMZN blockhead!
Charlie Brown:…
Lucy: 5 cents please
It wasn’t just the Cloud that crushed it for Amazon. Their core retail business also made significant strides…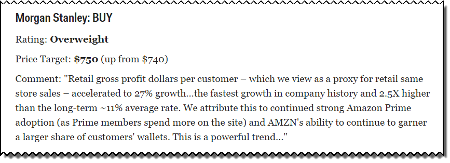
And as Amazon grows, so does their appetite for employees…
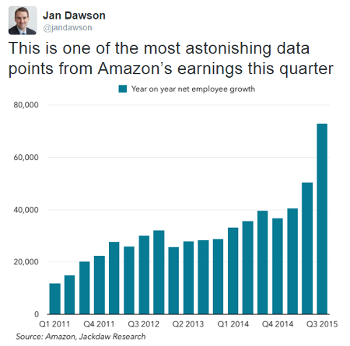
Could all of the last homebuilding cycle’s workers now be employed at Amazon?
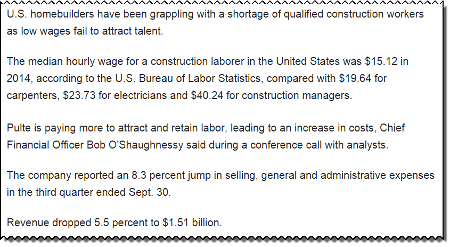
(Reuters)
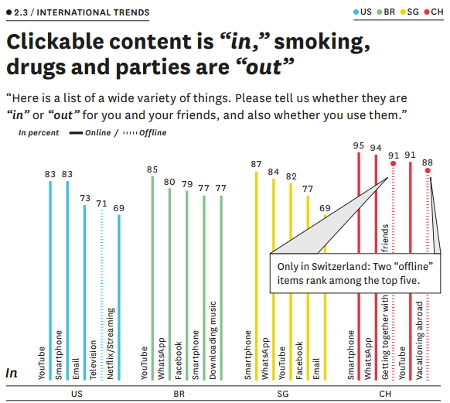
A good piece on youth trends in the U.S., Brazil, Swiss and Singapore…
Don’t forget that Facebook (O:FB) bought What’sApp.
Disclaimer: The information presented here is for informational purposes only, and this document is not to be construed as an offer to sell, or the solicitation of an offer to buy, securities. Some investments are not suitable for all investors, and there can be no assurance that any investment strategy will be successful. The hyperlinks included in this message provide direct access to other Internet resources, including Web sites. While we believe this information to be from reliable sources, 361 Capital is not responsible for the accuracy or content of information contained in these sites. Although we make every effort to ensure these links are accurate, up to date and relevant, we cannot take responsibility for pages maintained by external providers. The views expressed by these external providers on their own Web pages or on external sites they link to are not necessarily those of 361 Capital.
