The U.S. market rallied into election day, and then sold off after President Obama was re-elected. During the selloff the trends of all four major U.S. indices realigned, for the first time since early October. For the week the SPX/DOW were -2.25%, and the NDX/NAZ were -2.65%. Asian markets lost 1.4%, European markets lost 2.1%, and the DJ World index lost 2.1%. On the economic front positive reports outpaced negative reports seven to two. On the downtick: ISM services and the WLEI. On the uptick: consumer credit, the trade deficit, export/import prices, consumer sentiment (five-year high), wholesales inventories, and weekly jobless claims improved. This week we get to review the FOMC minutes, plus reports on Retail sales, the PPI/CPI and Industrial production.
Long Term: Bull Market
We continue to count the wave structure from March 2009 as an ongoing bull market. We have been expecting five Primary waves to unfold in this rising Cycle wave [1]. The first two Primary waves completed in 2011 at SPX 1371 and 1075 respectively. Primary wave III has been underway since that low. Primary wave I divided into five Major waves with a subdividing Major wave 1. Primary wave III has also been following a similar path, except Major wave 3 also appears to be subdividing. Should all work out as expected we should be seeing new all time highs shortly.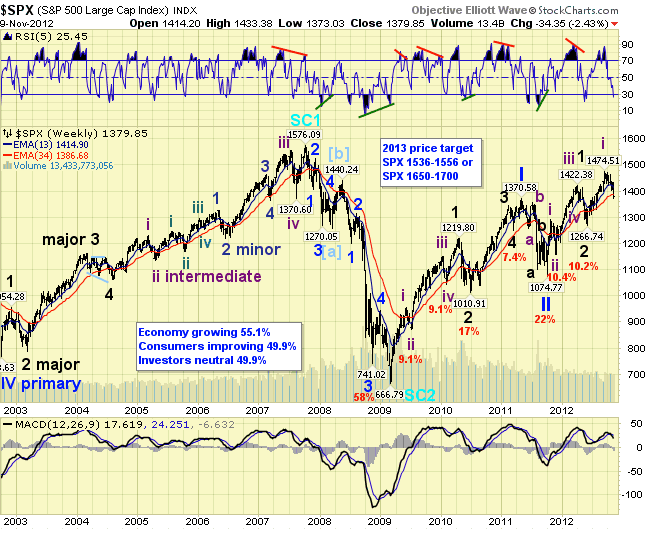
Our fundamental indicators suggest the economy is improving, consumers are getting optimistic for the first time in five years, the real estate market is rebounding, and both the FED and ECB have unlimited liquidity programs underway, or ready. Yet, four of our six long term technical indicators are again displaying weakness. This is not as bad as it was in 2011, at the Primary wave I high, when five of the six displayed weakness. Nor as bad as 2007, when all six displayed weakness and we entered a bear market.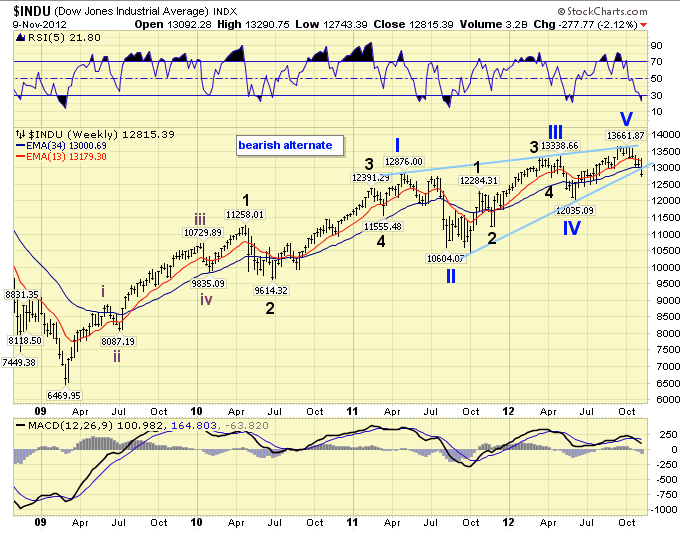
Whenever the majority of these long-term indicators turns negative we are forced to review the charts in search of a potentially completed wave pattern. In 2007 there were five impulse waves up, and the market turned bearish. In 2011 there were five impulse waves up, the market corrected 20% and then turned higher again. Now we do see a potential completed wave pattern as well. It is a bit odd, considering the length of the first wave, but noteworthy nonetheless. Currently with only four of the six long-term indicators negative and the market appearing to be in a normal Intermediate wave ii correction, we give this count a probability of 20%. However, should the DOW drop below 12,000 the probabilities increase dramatically. The DOW closed at 12,815 on friday.
Medium Term: Downtrend
For the past few weeks we have been waiting for all four major U.S. indices to align in confirmed downtrends. That happened this week. We also had calculated some retracement/fibonacci levels which should provide some support during the downtrend. The first level was the OEW 1386 pivot: a 38.2% retracement of the recent uptrend and wave C = 1.618 wave A. The second level was the 1363 pivot: a 50.0% retracement. The third level was SPX 1345/46: a 61.8% retracement and wave C = 2.618 wave A.
On wednesday the market broke through all our short term support levels, and found support at the OEW 1386 pivot. It held this support until just before the close on Thursday, then opened on friday at the OEW 1372 pivot and found support. The next logical support is the OEW 1363 pivot.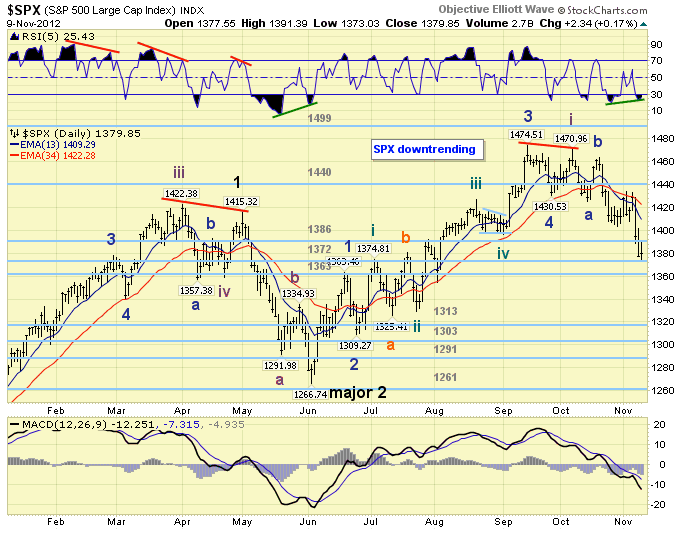
Technically, we now observe an oversold condition on the weekly charts, a positive divergence on the daily charts, and one more lower low could set up positive divergences on the hourly charts. All the ingredients for an upcoming downtrend low during this bull market. Medium term support is at the 1372 and 1363 pivots, with resistance at the 1386 and 1440 pivots.
Short Term
Short term support is at the 1372 and 1363 pivots, with resistnace at the 1386 pivot and SPX 1396/98. Short term momentum ended the week nearly oversold. The short term OEW charts remain negative with the swing level now at SPX 1404.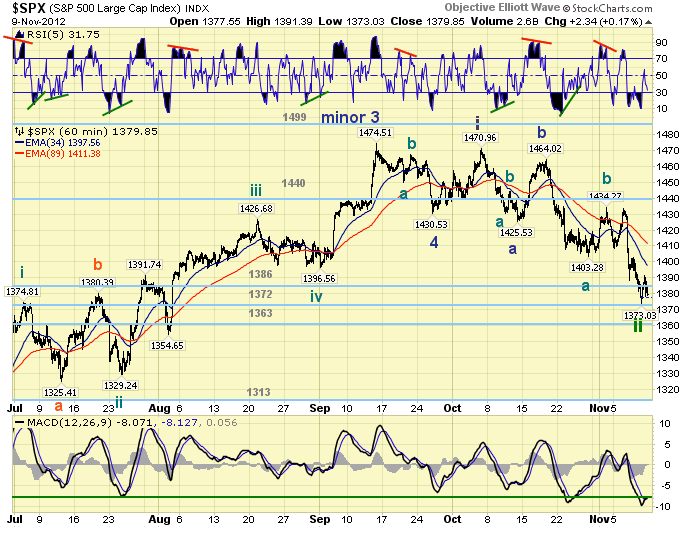
We have been counting this downtrend as a complex ABC. A three wave Minor wave A bottoming at SPX 1426. Minor B topping at SPX 1464, and a three wave Minor wave C underway. On friday, at the SPX 1373 low, Minor wave C had divided into two equal declining waves of exactly 61 points each. Besides the oversold condition, and the OEW pivot, probably one of the reasons for the volatility.
Also on friday the SPX rallied to 1391, overlapping the previous low at 1388. This suggests the market could have completed five waves down from SPX 1434: 1408-1433-1388-1403-1373. However, since Minute wave A (1464-1403) had a somewhat sloppy ending: drifting a few points lower than the five wave ending at SPX 1407. We can envision a similar ending for Minute wave C as it enters the OEW 1363 pivot range: 1356-1370.
Foreign Markets
- The Asian markets were mostly lower, losing 1.4%. Japan, S. Korea and Singapore are in confirmed downtrends.
- The European markets were mostly lower as well, losing 2.1%. All but Australia and Switzerland are in confirmed downtrends.
- The Commodity equity group were all lower, losing 2.1%. Brazil, Canada and Russia are in confirmed downtrends.The DJ World index is downtrending and lost 2.1%
- Bonds are uptrending and gained 0.9% on the week.
- Gold appears to be uptrending again, gaining 3.1% on the week.
- Crude is still in a downtrend, displays positive divergences, and gained 1.3% on the week.
- The U.S.D continues to uptrend gaining 0.5% on the week.
Tuesday kicks off the economic week with the Budget deficit. Wednesday: Retail sales, the PPI, Business inventories, and the FOMC minutes. Thursday: weekly Jobless claims, the CPI, the NY FED, and the Philly FED. Friday: Industrial production, Capacity utilization, and Options expiration. The FED gets active again with a speech from vice chair Yellen on tuesday. FED director Gibson gives Senate testimony on wednesday. Then on thursday FED chairman Bernanke gives a speech in Atlanta, GA. Best to your weekend and week!