
AMC Entertainment Holdings Inc. (NYSE:AMC) reported disappointing financial results in the second quarter of 2017, wherein both the top and the bottom line missed the Zacks Consensus Estimate.
Quarterly GAAP net loss was $176.5 million or a loss of $1.35 per share compared with a net income of $24 million or 24 cents per share in the prior-year quarter. Second quarter loss per share of $1.35 was wider than the Zacks Consensus Estimate of a loss of $1.33 per share.
Total revenue of $1,202.3 million was up a significant 57.4% year over year missing the Zacks Consensus Estimate of $1,212 million. Segment wise, Admission revenues were $761.4 million, up substantially 58.2% year over year. Food and beverage revenues were $374.1 million, up a whopping 53.6% year over year. Other theater revenues were $66.8 million, soaring 70.4% year over year.
Quarterly operating expenses were $1,221.9 million, up an enormous 72.5% year over year. Operating loss was $19.6 million against an operating income of $55.6 million. Adjusted EBITDA (earnings before interest, tax, depreciation and amortization) was $135.8 million, up 4.5% year over year. Adjusted EBITDA margin was 11.3% compared with 17% in the year-ago quarter.
The board of directors has approved the repurchase of up to $100 million of the company's Class A common stock over a two-year period.
Cash Flow
In the second quarter of 2017, AMC Entertainment generated a negative $56.2 million of cash from operations compared with a positive $111.1 million in the year-ago quarter. Free cash flow in the reported quarter was a negative $212.9 million compared with a positive $28.5 million in the prior-year quarter.
Liquidity
At the end of the second quarter of 2017, AMC Entertainment had $127.8 million of cash and cash equivalents and $4,264.1 million of outstanding debt compared with $207.1 million of cash and cash equivalents and $3,761 million of outstanding debt at the end of 2016. The debt-to-capitalization ratio, at the end of second-quarter 2017, was 0.63 compared with 0.65 at the end of 2016.
AMC Entertainment Holdings, Inc. Price, Consensus and EPS Surprise
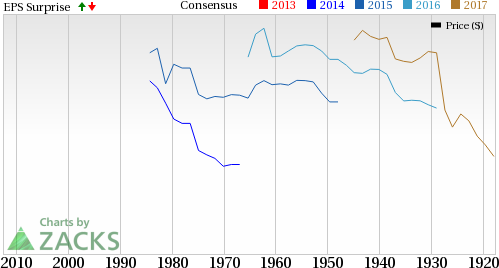
AMC Entertainment Holdings, Inc. Price, Consensus and EPS Surprise | AMC Entertainment Holdings, Inc. Quote
Operating Metrics
Number of screens operated was 10,776, up a whopping 104% year over year. Average ticket price was $9.33 compared with $9.62 in the year-ago quarter. In the reported quarter, food and beverage revenues per patron were $4.58 compared with $4.67 in the prior-year quarter. Consolidated attendance was 81,636,000, up a massive 63.3% year over year.
AMC Entertainment competes with major theatrical exhibitors like Cinemark Holdings Inc. (NYSE:CNK) , Live Nation Entertainment Inc. (NYSE:LYV) and Regal Entertainment Group (NYSE:RGC) . The company currently carries a Zacks Rank #3 (Hold). You can see the complete list of today’s Zacks #1 Rank (Strong Buy) stocks here.
Today's Stocks from Zacks' Hottest Strategies
It's hard to believe, even for us at Zacks. But while the market gained +18.8% from 2016 - Q1 2017, our top stock-picking screens have returned +157.0%, +128.0%, +97.8%, +94.7%, and +90.2% respectively.
And this outperformance has not just been a recent phenomenon. Over the years it has been remarkably consistent. From 2000 - Q1 2017, the composite yearly average gain for these strategies has beaten the market more than 11X over. Maybe even more remarkable is the fact that we're willing to share their latest stocks with you without cost or obligation. See Them Free>>
Regal Entertainment Group (RGC): Free Stock Analysis Report
Cinemark Holdings Inc (CNK): Free Stock Analysis Report
AMC Entertainment Holdings, Inc. (AMC): Free Stock Analysis Report
Live Nation Entertainment, Inc. (LYV): Free Stock Analysis Report
Original post
Zacks Investment Research