- In terms of key leads, the Dow Jones fell 0.19%, while the S&P 500 lost 0.13%. The Dow has now fallen for 6 days in a row, but the aggregated fall is only 1.2% - such is the lack of volatility.
- US July ISM manufacturing prints a below expectations 52.6, but still suggests Q3 GDP is set to rebound above 2%.
- The big mover has been oil, with US crude down 4.1% from the ASX 200 cash close. Front month is lost 24% from 9 June high. Traders’ pointing to the biggest increase in net short crude futures positions since 2006.
- US crude holding below the 5-day moving average. As long at the sellers respect this level then rallies will be sold and one can expect further downside.
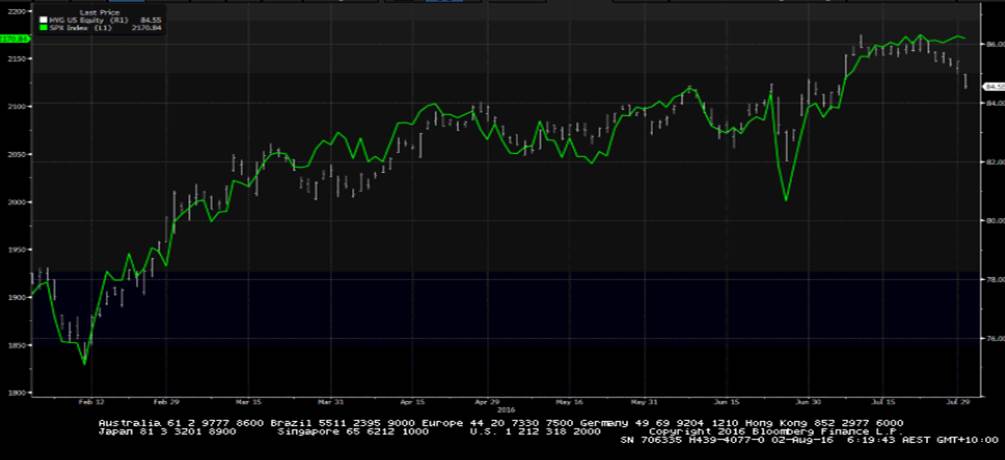
- If credit is the guide for equites, then the high yield corporate credit market suggests developed equity markets could be seeing lower levels – see chart below.
- The default rate in the high yield space now stands at 4.5%. This sounds low, but it’s the highest since August 2010.
- The ASX 200 is likely to see modest downside on open, with our call at 5578 (-0.1). BHP Billiton (AX:BHP) likely to follow the oil price lower, than take inspiration from a 4.9% gain in the iron ore price.
- As a guide for local energy names, the S&P 500 energy sub-sector fell 3.3%.
- Obviously the RBA front and center, with the market pricing a cut at a 66% probability.
- With AUD/USD trading from $0.7610 at 16:00 (AEST) to $0.7534, the bigger reaction today clearly comes from a failure to cut.
- Some weakness expected in Japanese equities on open, with focus on the details of the ¥28 trillion stimulus. In terms of genuine fiscal stimulus measures the devil is in the detail.
The moves in oil have to be on the radar, as they are causing high yield credit to roll over and spreads to widen relative to US treasuries. Importantly, there has been no real stress in the Investment-Grade corporate bond market, but if equities always follow credit then we have to think the near-term path of equity markets is now lower.
White line – High yield ETF (HYG), green – S&P 500

In the ASX 200 the market internals have been flashing red for a while, with the level of companies above their 20- and 50-day averages well above 80% and at levels where the market has tended to peak out over the past five years.
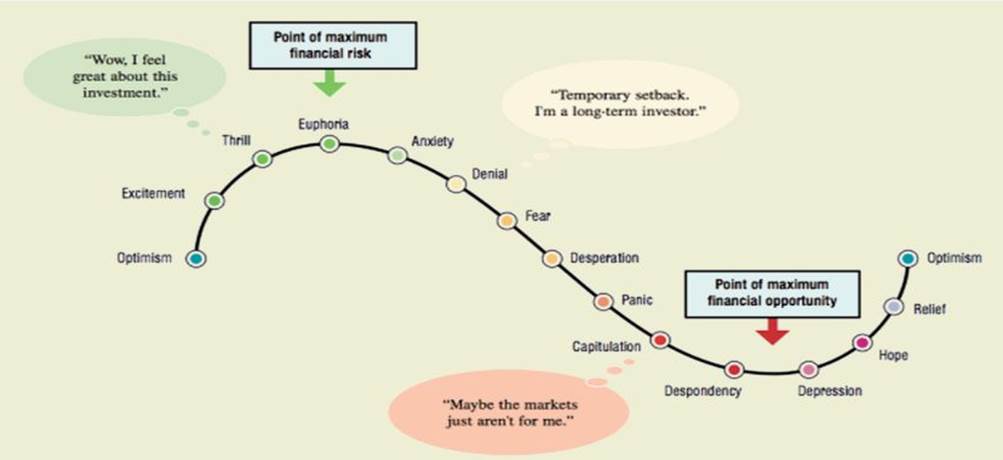
We now have 24% of companies with an RSI (relative strength index) above 70, which highlights that we have seen broad participation in the recent rally higher, but if we take Sir John Templeton’s classic quote ‘bull markets are born on pessimism, grow on scepticism, mature on optimism and die on euphoria’, what we are trying to ascertain now is whether we are in the ‘euphoria’ stage.

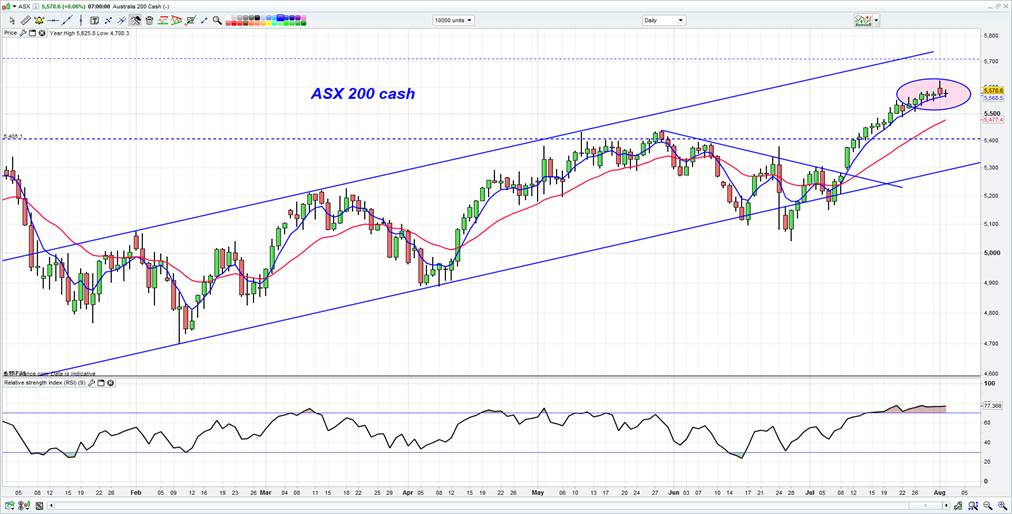
The fact the ASX 200 continues to hold above the five-day average is key for now (see the blue line on the daily chart below) and as long as it holds this level then short positions are ill advised.
However, we have seen clear indecision in the price action yesterday and the bears are seemingly wrestling back some sort of control. A close below 5546 would catch my attention as not only would the index close below the short-term average (for the first time since 7 July rally), but it would also print its first lower low.

One suspects few will be willing to trade too aggressively ahead of the 14:30 (AEST) Reserve Bank decision. Usually, the impact of the actions of the RBA are contained to the rates and FX market, but given the moves we have seen of late in higher yielding sectors and discretionary names, one suspects we could see a strong reaction if the RBA leave the cash rate at 1.75%.
Stocks with positive earnings translation from a lower AUD effect will likely struggle, so traders just be aware of the event risk and adjust risk management accordingly. A failure to cut and a viscous spike higher in AUD/USD will likely ensue, although if the statement puts the onus on cutting in an upcoming meeting then we could see sellers emerge not $0.7650 to $0.7700.
I would stand aside though and wait for Europe and US traders to give the move their full consideration, but I side with market pricing and feel on balance a cut is likely.
