Technical analyst Clive Maund charts an agritech company that he believes is set to break out.
Verde AgriTech Plc (TO:NPK; OTC:AMHPF) continues to move forward with its projects, including its proprietary product for farmers called Super Greensand, which is a potash based nutrient mix, and a few days back the company was awarded a permit to produce 50,000 tons of the stuff, and it has plans to go well beyond that. The market yawned at this news.
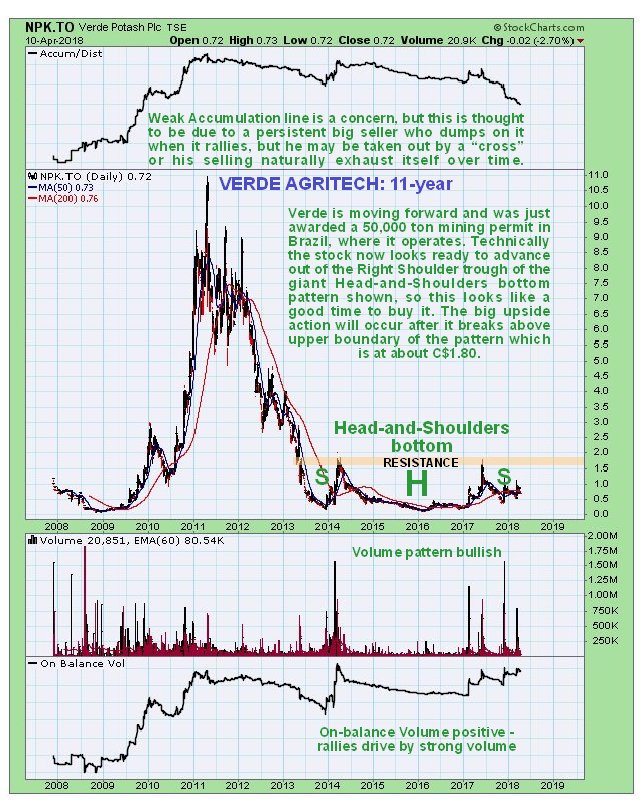
Technically, the stock appears to be getting ready to break out of a giant Head-and-Shoulders bottom as we can see on its latest 11-year chart shown below. From a price/time perspective we appear to be close to an optimum entry point here, as the price is still not far above the Right Shoulder low of this pattern. Breakout from this base pattern will be signaled by the price breaking above the resistance at its upper boundary, which is at about C$1.80, so clearly, just getting to this breakout point will result in a big percentage gain from the current price. Once it breaks above C$1.80 its rate of rise should accelerate.

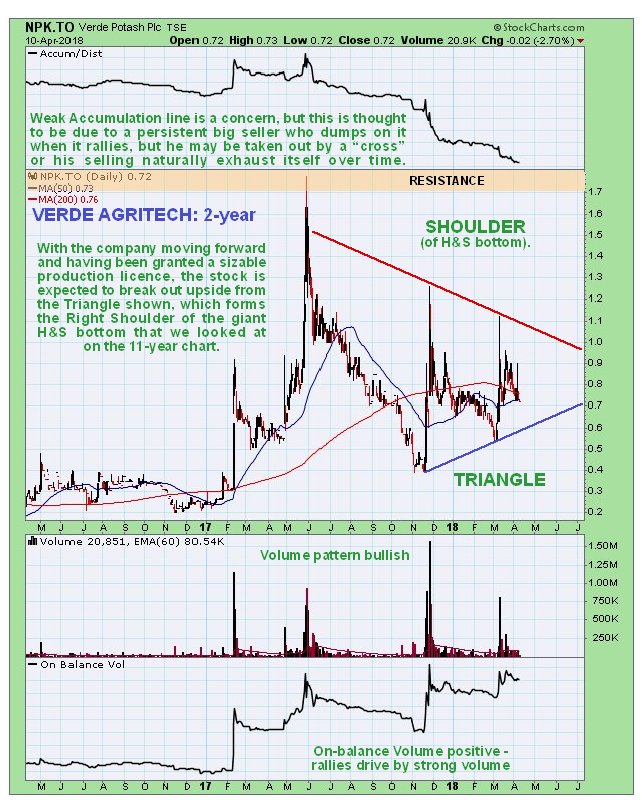
On the 2-year chart we can look at price/volume action in the Right Shoulder of the H&S bottom pattern in detail. On this chart we see that the Right Shoulder is taking the form of a Symmetrical Triangle. The sudden spikes on big volume within this pattern (and before it) are bullish and this high upside volume has driven the On-balance Volume higher and it is still close to making new highs, a positive sign. However, a strange and potentially concerning anomaly is the weak Accumulation line.
What appears to be going on here is that whenever the price spikes a big seller comes out of hiding and dumps onto the rally, driving the price back down (and the Accum line). What will probably happen is that the company will arrange a "cross" trade to take him out, or his selling will naturally exhaust itself over time, but in any event it is not thought to constitute a formidable obstacle. Observe how the Triangle is closing up, so an upside breakout should occur quite soon.

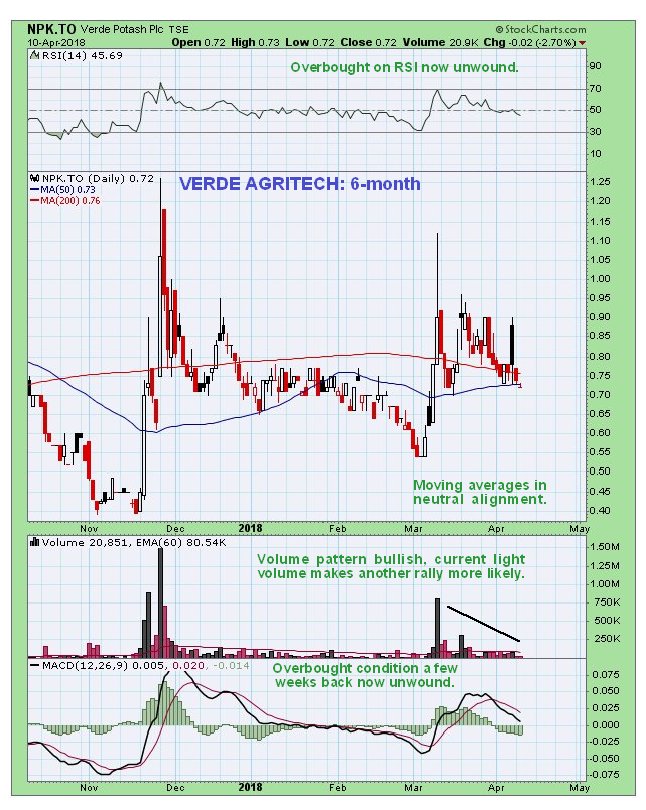
On the 6-month chart we can review recent action in more detail. On this chart we can see 2 spikes—the one last November, that arose from the Right Shoulder low of the Head-and-Shoulders bottom, which was followed by a long and tedious reaction, and the one early last month, which has been followed by another reaction, that is thought less likely to be so deep, because the Triangle is now closing up, making it more likely that it will "get on with it" and break out of it.

Conclusion: Verde Agritech is rated a buy here, for a breakout from its Triangle leading initially to a challenge of the resistance at the upper boundary of the H&S bottom pattern at about C$1.80. Buyers should be aware that there is some (lesser) chance that it will first drop back to the support at the lower boundary of the Triangle now at about C$0.60. Long-term, once it has broken out of the base pattern, a major bull market will be in prospect. Verde Agritech trades in light volumes on the US OTC market, where for this reason it should be avoided for now. There are 37.3 million shares in issue, which is modest.
Disclosure: 1) Clive Maund: I, or members of my immediate household or family, own shares of the following companies mentioned in this article: None. I personally am, or members of my immediate household or family are, paid by the following companies mentioned in this article: None. My company has a financial relationship with the following companies mentioned in this article: None. CliveMaund.com disclosures below. I determined which companies would be included in this article based on my research and understanding of the sector.
