Gold has been on a wild ride since the US election results last Wednesday, climbing to a high on the day of the election of $1,336 before slumping lower at the end of the trading closing at $1,277.
Since last Wednesday investors have continued to dump the precious metal as the selling accelerated. On Monday morning the selling resumed as the world and investors continued to digest the shock victory of Trump and what this means for the US and the World.
During Monday's trading day gold slowly recovered some of its losses to find support as investors bid gold higher into Tuesday's trading, where it currently sits at $1,227.
Gold Chart Review
To gain a better understanding of the where gold is most likely heading over the coming weeks, its always ideal to take a look at a longer term chart to see where its been in the past.
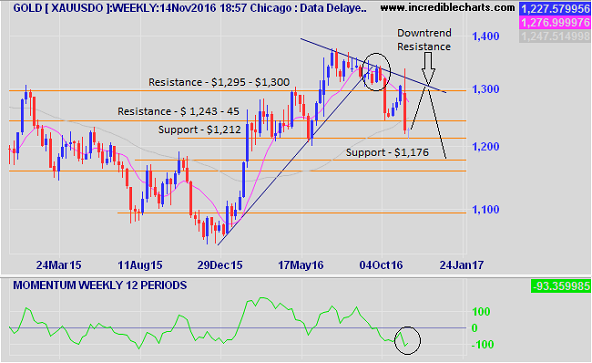
If we take a look at the weekly chart of gold below, you will notice that bullish uptrend that began in late December last year ended in September as it was unable to stay above its trend line. (See circle over price chart)
Since September, gold has been on a steady decline lower even though it made an attempt to climb higher towards its new down trend line (now at 1,300 level), before reversing and heading back down again to the current price of around $1,227.
Presently its only 15 dollars off its support line at $1,212 which previously was a strong support level during its uptrend cycle back through February to May this year.
Failure to hold the $1,212 level on a weekly basis, gold's next support level is around the $1,176 level. If it was to reach the lower support level that would be another $36 lower from the $1,212 support level.
Given the big selloff last week, its quite possible that we may see a temporary rally higher potentially back to the $1,295 -$1,300 level before once again reversing and falling below the $1,212 support level towards $1,176 support as indicated in the chart. (See black lines on chart)
Lastly I have included the momentum indicator on the weekly chart, which is currently sitting at -93 to show that gold is in a strong bearish position and firmly stuck in a new down trend.
Now that the market has decided that the big risk factor of the US election is over, the market has chosen the direction for gold. Given the current technicals its unlikely the overall long term down trend direction will change for some time.

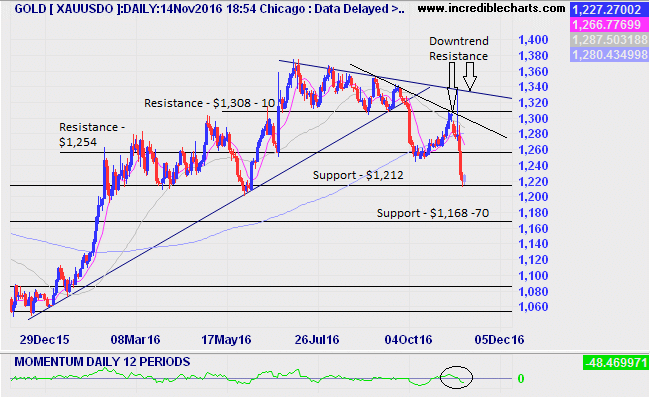
With the daily chart below you can see that the selling as stopped for the time being as the $1,212 support level held after consecutive days of selling.
Similar to review of the weekly chart, its likely that gold will stage a rally higher off the support level over the coming week or two. The most likely targets are the first resistance level at $1,254, followed by the new down trend resistance level. The downtrend resistance is indicated with the arrows within the chart with the first resistance around the $1,285-90 level followed by the original downtrend resistance at $1,330.
Once the short term rally has exhausted itself over the next 1-2 weeks, we could see gold reverse as it heads back down to $1,212 support. Given its downtrend trajectory and the technicals showing bearish signals, we would most likely see gold fall below the $1,212 support to the next support level of $1,168 - 70 support level over the medium term.
December Wild Card For Gold
Keep in mind the wild card that is coming up in December is the FED committee meeting, where the market is currently pricing in an over 80% chance of an interest rate rise in December. If this occurs in December its possible that gold could react similar to last December FED decision. If you recall nearly a year ago gold spiked significantly higher reversing the downtrend and beginning a new uptrend.

Disclaimer: This post was for educational purposes only, and all the information contained within this post is not to be considered as advice or a recommendation of any kind. If you require advice or assistance please seek a licensed professional who can provide these services.
