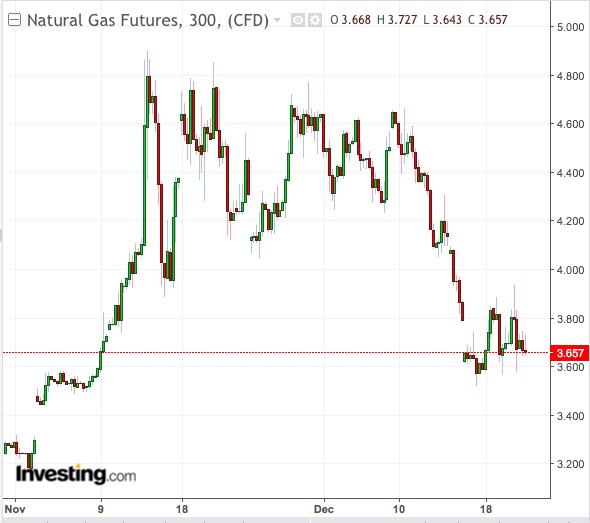
The second triple-digit storage draw of the cold season has come and gone for natural gas and done zilch for market bulls.
Those who had banked on the event to bring gas futures back to $4 levels now face the specter of more corrections as supply remains undesirably high while the frigid weather that ensures high and consistent heating demand hasn’t held.
With just a week of trading left to 2018, natural gas is still the top performing commodity of the year. But the huge gap it once had with other markets has narrowed dramatically after three straight weeks of price drops.
Nat Gas’ Once Huge Gap With Other Commodities Narrowed

At Thursday’s settlement of $3.726 per million metric British thermal units (mmBtu), the front-month January contract was up about 25 percent on the year. Three weeks ago, that gain was 55 percent, while in late November it was nearly 60 percent. Wheat, the commodity with the second highest returns, was up 22 percent on the year, just a little behind natural gas (desktop users, click here and go to “performance” to see all commodity returns for 2018).
Until spring this year, gas prices were muted, trading well below $3 per mmBtu. From May, the market took off, on a wave of cooling demand first, and later heating.
The first demand surge was during the summer, when utilities had to burn unusually large amounts of gas each week to meet spikes in power usage caused by the heavy use of air-conditioners at that time to beat the hot weather. The next demand wave was caused by an unexpected burst of cold during the fall season that led to premature heating demand.
A ramp up in exports of liquefied natural gas has also boosted the demand equation for US natural gas this year. From just around 3 bcf per day a year ago, LNG export capacity is almost at 5 bcfd now. The EIA expects it to reach nearly 9 bcfd by the end of next year, making the United States the third largest LNG exporter after Qatar and Australia.
Mixed Weather Hitting Gas Consumption
But with gas prices topping nearly $5 per mmBtu in November, their highest since 2014, weather patterns became more mixed, affecting demand. Production, meanwhile, remained not far from the record highs seen earlier in the year. The result was a higher accumulation of gas in underground storage caverns than desired. While weekly consumption of at least 100 billion cubic feet was required to keep prices at the year’s high, there had only been two such triple-digit drawdowns over the past five weeks. And last week’s draw of 141 bcf was even lower than the five-year average of 144 bcf for this time of year.
Dan Myers, analyst at Gelber & Associates, a consultancy in Houston, noted that last week’s draw was the second consecutive one to fall under the five-year average, despite a strong shot of colder-than-normal temperatures in the first half of December. Said Myers:
“Firm supply has softened recent withdrawals and will have a chance to really dampen withdrawals during the current spate of milder weather, especially if it is bolstered by further production growth late this month.”
More Downside Than Upside For Prices
Myers said there was still chance for extreme cold to override record production this winter, but added that in the near term “mostly-normal temperature forecasts will weigh on prices as long as they continue”.
Dominick Chirichella, director of risk and trading at the Energy Management Institute (EMI) in New York, concurred. He added:
“The warming trend for the rest of the year across the main Nat Gas consuming regions of the country is taking center stage and is the current main price driver for the complex.”
So how low could prices go?
Myers notes that natural gas contracts from April through December 2019 were averaging near $2.85 per mmBtu, about $1 per mmBtu below benchmark January pricing.
Weather Forecasts Aren’t Showing A Lot Of Cold
And unless it gets a lot colder very quickly, reaching for $4 levels might be difficult over the next two months despite January and February typically being the coldest months of winter.
Chirichella said:
“Until there is a clear signal that winter like weather is returning, Nat Gas prices are likely to remain on the defensive.”
And upcoming weather trends aren’t encouraging. Latest short-term temperature forecasts show normal temperatures reappearing over the upper US Midwest and stretching out to New England.
The eight to fourteen-day forecast is also less supportive than the shorter term forecast. It shows that the cold weather expected in the western third of the country would be more than offset by above normal temperatures prevailing over most of the US.
Added Chirichella:
“I am maintaining my NatGas view and bias to cautiously bearish as the market is now below another range support level.”
