
Acorda Therapeutics, Inc. (NASDAQ:ACOR) reported adjusted earnings of 61 cents per share in the fourth quarter of 2017, which missed the Zacks Consensus Estimate of $1.09. However, the bottom line significantly increased from the year-ago figure of 5 cents.
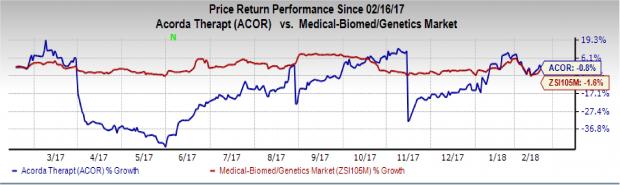
Acorda’s shares decreased almost 2% following its earnings release. In fact the stock has dipped 0.8% in a year’s time, comparing favorably with the industry’s 1.6% decline.
Total revenues came in at $188.4 million, surpassing the Zacks Consensus Estimate by 9.5%. Moreover, the top line improved 34% year over year owing to higher net product as well as royalty revenues.
Quarter in Detail
Majority of Acorda’s net product revenues were generated by the company’s key drug Ampyra, which raked in sales of $167.2 million in the quarter. Revenues grew around 26% both year over year and sequentially.
Ampyra is marketed in the ex-U.S. markets by Biogen Inc. (NASDAQ:BIIB) under the trade name, Fampyra. Biogen pays royalties to Acorda on the outside U.S. sales of Fampyra. Fampyra royalties were $3.1 million, up 14.8% year over year.
Notably, in the fourth quarter, royalty revenues massively surged to $16 million from the year-ago figure of $4.4 million.
Acorda’s research and development (R&D) expenses declined 35.2% year over year to $32.9 million. Selling, general and administrative (SG&A) expenses also lowered 35.7% to $34.1 million.
Pipeline Updates
In December 2017, Acorda resubmitted the new drug application (NDA) to the FDA for its pipeline candidate, Inbrija, as a treatment option to address the OFF period symptoms in Parkinson’s affected people udergoing a carbidopa / levodopa regimen. The company expects a response from the regulatory agency this month.
We remind investors that last August, the company had received a refusal-to-file letter from the FDA in connection with the NDA for Inbrija. The regulatory body deemed the application incomplete after a preliminary review and wanted some additional supporting information to reassess the filing. Subsequently, after discussing with the FDA to resolve the issue, the company resubmitted the same in the aforementioned period.
Notably, Acorda has deferred its plan to submit regulatory applications for Inbrija in the EU to the first quarter of 2018, earlier expected to be filed by 2017-end.
In November 2017, the company announced to have discontinued the phase III study on one of its lead Parkinson’s disease candidates, tozadenant. This decision was prompted by a serious safety issue detected in the study. Acorda expects to report the efficacy and safety data from the phase III trial in the first quarter of 2018.
2017 Results
Full-year sales increased 13.2% year over year to $588.3 million, beating the Zacks Consensus Estimate of $578.6 million. The top line also surpassed the preliminary results of $542 million.
The full-year earnings of $1.75 per share missed the Zacks Consensus Estimate of $1.81. However, the bottom line is significantly higher than the year-ago figure of 25 cents.
2018 Guidance
The company maintained its Ampyra net sales guidance for 2018 in the range of $330-$350 million. This is lower than the Ampyra full year 2017 revenue of $543.3 million due to the expected generic entry of the drug in the United States in July, 2018.
The company continues to project its R&D and SG&A expenses for 2018 in the band of $100-$110 million and $170-$180 million, respectively.
Acorda awaits a positive cash balance in excess of $300 million by the end of 2018.
Acorda Therapeutics, Inc. Price, Consensus and EPS Surprise
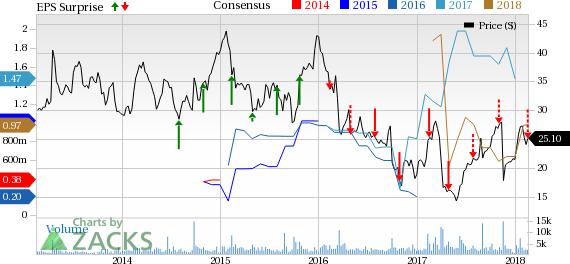
Acorda Therapeutics, Inc. Price, Consensus and EPS Surprise | Acorda Therapeutics, Inc. Quote
Zacks Rank & Key Picks
Acorda carries a Zacks Rank #4 (Sell).
Two better-ranked stocks in the health care sector are Exelixis, Inc. (NASDAQ:EXEL) and XOMA Corporation (NASDAQ:XOMA) . While Exelixis sports a Zacks Rank #1 (Strong Buy), XOMA carries a Zacks Rank #2 (Buy). You can see the complete list of today’s Zacks #1 Rank stocks here.
Exelixis’ earnings per share estimates have been revised upward from 72 cents to 77 cents for 2018 over the last 60 days. The company pulled off a positive surprise in all the trailing four quarters with an average beat of 572.92%. Share price of the company has surged 31.5% in a year’s time.
XOMA’s loss per share estimates have narrowed from 99 cents to 42 cents for 2018 over the last 60 days. The company came up with an average beat of 47.92%. The stock has skyrocketed 416.1% in the last 12 months.
Wall Street’s Next Amazon (NASDAQ:AMZN)
Zacks EVP Kevin Matras believes this familiar stock has only just begun its climb to become one of the greatest investments of all time. It’s a once-in-a-generation opportunity to invest in pure genius.
Acorda Therapeutics, Inc. (ACOR): Free Stock Analysis Report
XOMA Corporation (XOMA): Free Stock Analysis Report
Biogen Inc. (BIIB): Free Stock Analysis Report
Exelixis, Inc. (EXEL): Free Stock Analysis Report
Original post
Zacks Investment Research