
Business services provider ABM Industries Incorporated (NYSE:ABM) recorded solid second-quarter fiscal 2017 (ended Apr 30, 2017) results on the back of revenue improvements across most of the operating segments. Adjusted earnings (from continuing operations) for the reported quarter were $27.8 million or 49 cents per share compared with $17.7 million or 31 cents per share in the year-ago quarter. Adjusted earnings for the quarter beat the Zacks Consensus Estimate by 6 cents.
On a GAAP basis, net income for the reported quarter was $31.3 million or 55 cents per share compared with $4.4 million or 8 cents per share in the year-earlier quarter. The year-over-year increase was primarily attributable to top-line growth and impairment recovery related to the Government Services business.
Top-Line Improvement
Revenues for the reported quarter increased 4.2% year over year to $1,310.5 million, largely driven by growth in the Aviation segment due to new businesses from existing clients. Rise in revenues from the Aviation segment were driven by higher passenger services, cabin cleaning, and parking and transportation services with new and existing customers. Organic growth improved 3.6% year over year, while acquisitions contributed $8.7 million of incremental revenues during the quarter. Quarterly revenues exceeded the Zacks Consensus Estimate of $1,308 million.
Operating profit improved to $51.0 million from $11.8 million in the year-ago period, owing to higher revenue contribution and organizational savings due to the Vision 2020 plan. Adjusted EBITDA (earnings before interest, tax, depreciation and amortization) for the reported quarter increased to $60.5 million from $46.0 million in the year-earlier quarter for respective margins of 4.6% and 3.7%.
Financial Position
Cash and cash equivalents at the quarter end were $55.7 million with total debt aggregating $406.8 million. Net cash provided by operating activities during the quarter was $59.3 million compared with $86.3 million in the prior-year period.
During the quarter, the company did not repurchase any shares under its share repurchase program. As of Apr 30, 2017, ABM had shares worth $134.1 million remaining for repurchase under its $200 million share buyback program.
ABM Industries Incorporated Price, Consensus and EPS Surprise
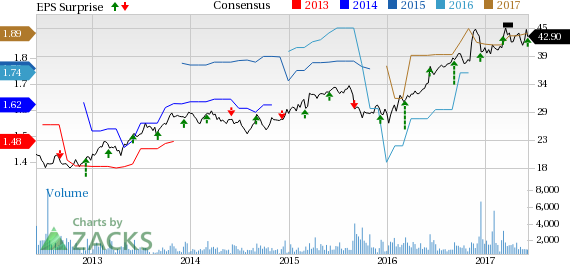
ABM Industries Incorporated Price, Consensus and EPS Surprise | ABM Industries Incorporated Quote
Divesture of Government Services Business
Subsequent to the quarter end, ABM completed the sale of the Government Services business to an affiliate of Valiant Integrated Services for pre-tax proceeds of $35.5 million. The company recorded an impairment recovery of $17.4 million during the quarter for the transaction.
Fiscal 2017 Guidance Raised
With strong quarterly results and steady progress in its Vision 2020 plan and lower-than-expected overhead expenses, ABM raised its fiscal 2017 guidance. For the fiscal year, it expects adjusted income from continuing operations in the range of $1.85–$1.95 per share, up from the earlier projection of $1.80–$1.90. GAAP income from continuing operations is expected within $1.63–$1.73 per share, significantly up from $1.40–$1.50 anticipated earlier.
Going Forward
ABM’s comprehensive, strategic and transformation initiative is focused on driving sustainable profitability by effectively allocating resources to higher margin services and business verticals with a strong competitive edge. We expect this to fuel the company’s growth momentum in the coming quarters.
ABM currently has a Zacks Rank #3 (Hold). Some better-ranked stocks in the industry include CBIZ, Inc. (NYSE:CBZ) , PageGroup plc MPGPF and NV5 Global, Inc. (NASDAQ:NVEE) , each carrying a Zacks Rank #2 (Buy). You can see the complete list of today’s Zacks #1 Rank (Strong Buy) stocks here.
CBIZ has beaten earnings estimates twice in the trailing four quarters with a positive surprise of 18.4%.
PageGroup has a long-term earnings growth expectation of 15%.
NV5 Global has a long-term earnings growth expectation of 20%. It has beaten earnings estimates twice in the trailing four quarters with a positive surprise of 1.8%.
3 Top Picks to Ride the Hottest Tech Trend
Zacks just released a Special Report to guide you through a space that has already begun to transform our entire economy...
Last year, it was generating $8 billion in global revenues. By 2020, it's predicted to blast through the roof to $47 billion. Famed investor Mark Cuban says it will produce "the world's first trillionaires," but that should still leave plenty of money for those who make the right trades early. Download Report with 3 Top Tech Stocks >>
ABM Industries Incorporated (ABM): Free Stock Analysis Report
CBIZ, Inc. (CBZ): Free Stock Analysis Report
NV5 Global, Inc. (NVEE): Free Stock Analysis Report
PAGEGROUP PLC (MPGPF): Free Stock Analysis Report
Original post
Zacks Investment Research