The main idea of the overviews from the previous period was the assumption about the probability of the end of the multi-month US dollar’s strengthening. Both fundamental and technical arguments were mentioned. At the same time, for a more correct conclusion, the possibility of a short-term period of strengthening the dollar was assumed, which is necessary to update extreme annual values in currency pairs with its presence. Firstly, the Brexit negotiation process contributes to the strengthening of the dollar toward European currencies. Today a vote of no confidence in Prime Minister Theresa May can be put to a vote. If approved, strong volatility will be observed in world currency markets, which, first of all, will be reflected in a sharp weakening of the British currency. Secondly, the extension of the transition period, during which Britain will continue to finance EU projects, to pay a membership fee, but will be deprived of the right to participate in decision-making, is a red rag for British parliamentarians, which undermines their national pride. Under these conditions, the probability of passing the draft Agreement through the British Parliament is close to zero, which leads to a "hard" option for the UK to exit without an Agreement. However, from my point of view, the Brexit factor is a short-term one, because the clarity on this issue should come by the end of November. At the same time, at the end of last week, in the speeches of a number of representatives of the Federal Reserve began to appear notes of doubt about the need to maintain the previous pace of tightening monetary policy. Richard Clarida, the new Fed Vice Chairman, pointed to a slowdown in global economic growth and expressed the opinion that the interest rate after three years of its increase by the Fed is close to the “neutral” level. At the same time, the President of the Federal Reserve Bank of Philadelphia, Patrick Harker, said that he was not ready to support another rate rise in December, considering restrained prediction for inflation. These statements, after the expected rate rise in December, indicate the possibility that the US regulator in early 2019 will take a pause in its actions, which will be a negative factor for the dollar.
In today's overview, charts for some currency pairs are presented on smaller time frames. From a technical point of view, is observed the formation of local signals of strengthening the US currency.
The main event on Tuesday will be the speech of the head of the Bank of England Mark Carney and the regulator's report on inflation. The main thing in his speech is to assess the dynamics of the national economy, the prospects for further monetary policy and possible actions of the regulator in the case of "hard" Brexit.
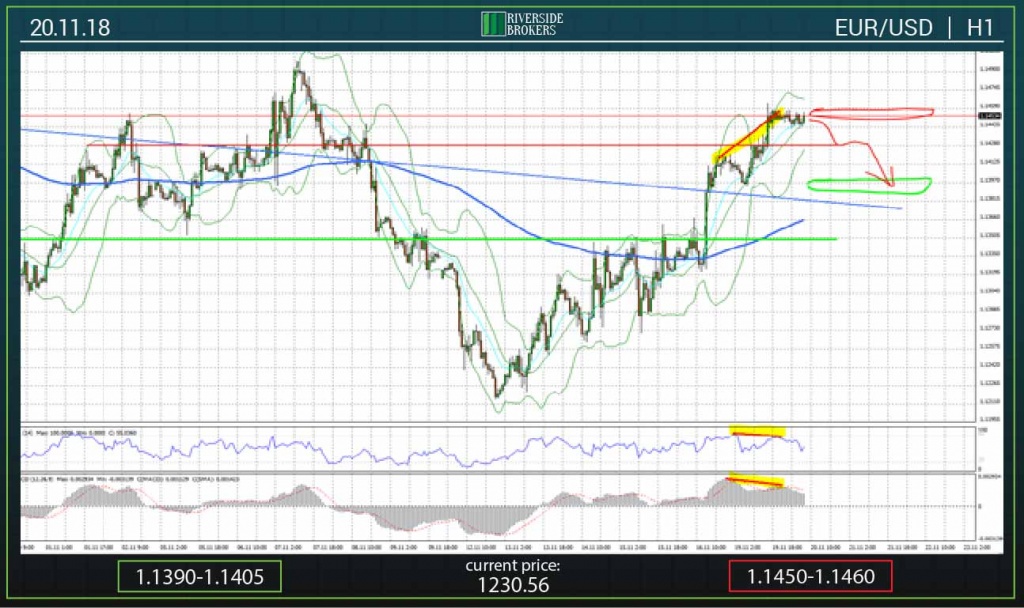
Following the results of trading on Monday, the hourly chart of the EUR/USD pair formed a divergence between the highs of prices and the values of the RSI and MACD indicators. Based on this, it is predicted a gradual decrease in quotations to the support zone located near the 1.1400 mark. The upper limit of the medium-term channel, in which the pair has been trading since may this year, is just below this level. At the same time, the reaction of the markets to the speech of the head of the British regulator Mark Carney will be important for the pair today.
The support zone today is in the area of 1.1390-1.1405.
The resistance zone is in the range of 1.1450-1.1460.
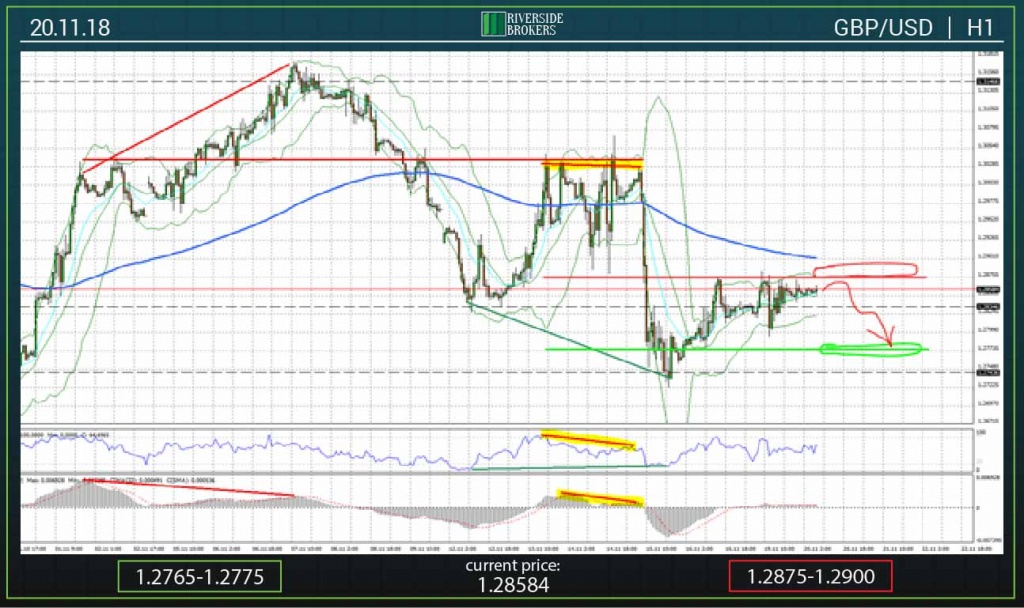
Yesterday, the GBP/USD quotes stabilized slightly below resistance at 1.2865-1.2875. The pair is on wary expectation of messages related to Brexit. The slightest negative news may send prices to the area of annual minimums. As noted in yesterday’s review, in the case of “hard” Brexit, prices may drop to the area of 1.2300-1.2400. Today, the main event is the speech of the head of the Bank of England Mark Carney. The main interest of market participants is to obtain information about the future plans of the regulator on monetary policy and possible actions in case of a British exit from the European Union without an Agreement. Today, the side dynamics of prices is predicted in anticipation of the above-mentioned speech of the head of the British regulator. After that is not excluded the beginning of the decline of quotations to the support located near the 1.2775 mark.
The support zone today is in the area of 1.2765-1.2775 (green oval).
The resistance zone is present in the range 1.2875-1.2900 (red oval).
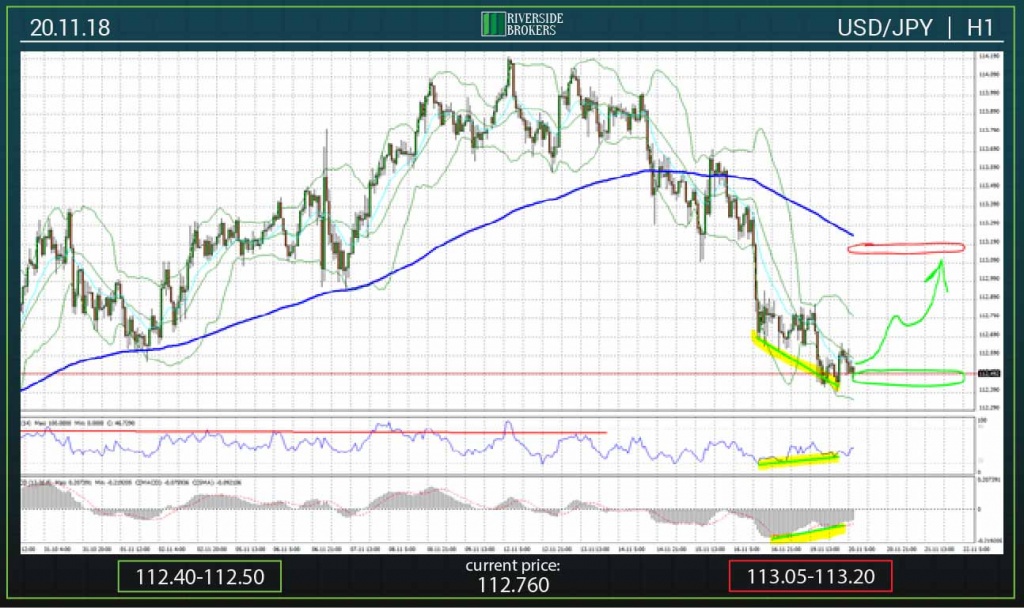
Today, the dynamics of quotations of the pair USD/JPY is presented on the hourly time frame. On the chart, a yellow signal indicates a convergence signal between price minima and RSI and MACD indicator values. Based on this, it is assumed the probability of termination of the negative dynamics of quotations and a corrective rise in prices to the level of 113.00. At the same time, in the medium term, the negative dynamics may continue to reduce to the region the 200-period daily MA, passing through the level of 111.50.
The support zone is the range 112.40-112.50 (green oval).
The zone of resistance is located in the area of 113.05-113.20 (red oval).
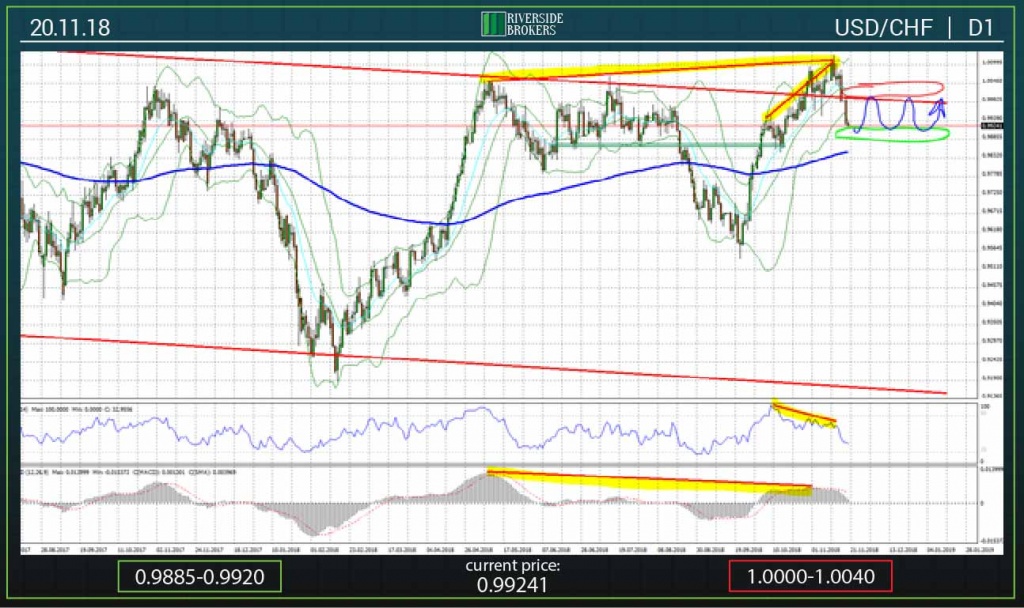
On Monday, the USD/CHF pair quotes worked out a divergence signal between the highs of the prices and the values of the RSI and MACD indicators. At today’s morning, the pair is in the area of 0.9920-0.9930, in the immediate vicinity of the support near the 0.9900 mark. In the specified area, the pair was trading from June 14 to August 20, which indicates the strength of support.
Today is predicted lateral dynamics of quotations. Resistance is the upper limit of the multi-year channel (the red line on the graph). Support is in the area of 0.9900, which was mentioned above.
The support zone is present in the region 0.9885-0.9920 (green oval).
Resistance is the range 1.0000-1.0040 (red oval).
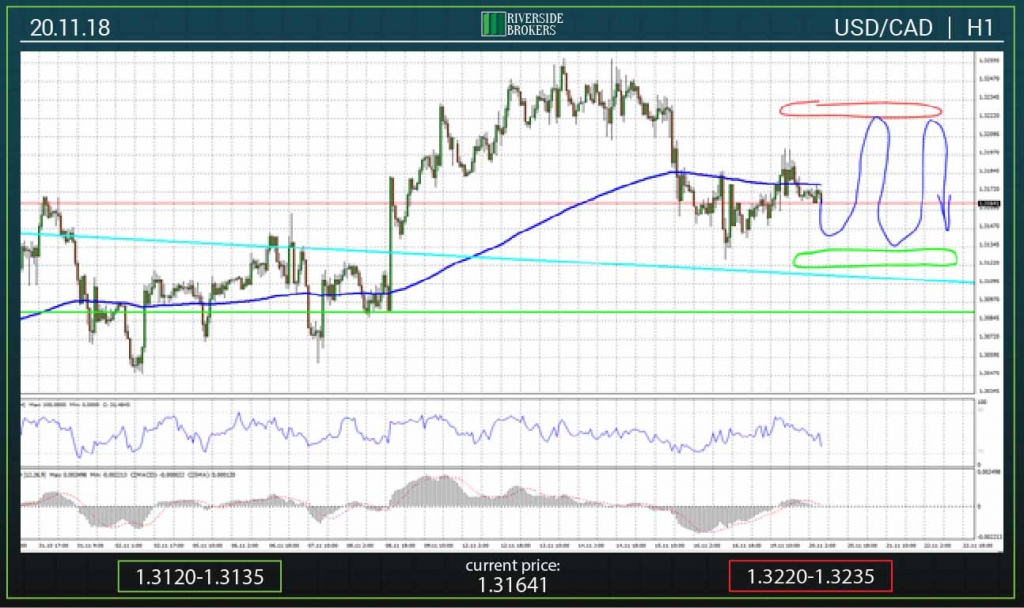
In this article, the USD/CAD chart is presented on the hourly time frame. After lowering from the area of maximum prices in the area of 1.3250, quotes in the last trading sessions stabilized just above the upper boundary of the multi-year triangle, passing through the range of 1.3115-1.3125. Similar to yesterday’s situation, lateral dynamics may continue today. The dynamics of quotations will follow the general sentiment in the market associated with the strengthening or weakening of the US currency.
Support is in the 1.3120-1.3135 area (green oval).
Resistance is located at 1.3220-1.3235 (red oval).
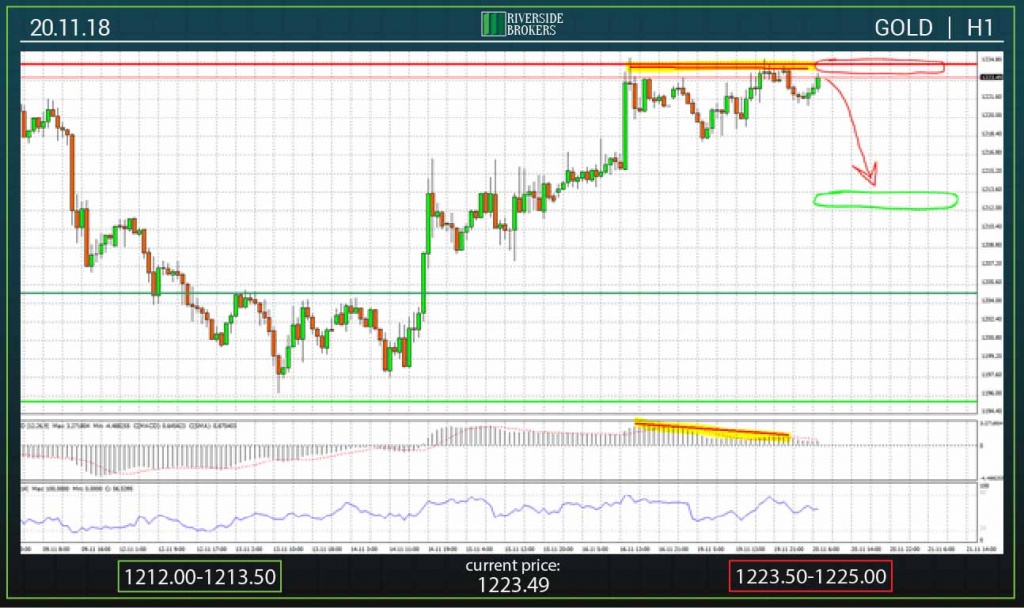
GOLD
On Monday, gold quotes periodically attempted to break through resistance located near the 1225.00 mark. At the same time, at the end of the day on the hourly chart recorded the appearance of a correction signal – the divergence between the price highs and the values of the MACD indicator. Based on this, quotes are now foreseen to decline to support near the 1213.00 mark.
The support zone today is located in the area of 12.00-1213.50 (green oval).
Resistance is present in the range 1223.50-1225.00 (red oval).