A number of physical commodities have demonstrated some fairly persistent seasonal tendencies. That’s the Good News. The Bad News is that there is no way to know whether or not a given trend will work “this time around.” Makes life interesting I guess.
Anyway, one of those “fairly persistent seasonal trends” involves crude oil showing weakness late in the calendar year. To wit, consider Figure 1, which displays the annual seasonal trend for crude oil (the blue line is the annual seasonal trend, the red line is the action of crude oil so far this year).
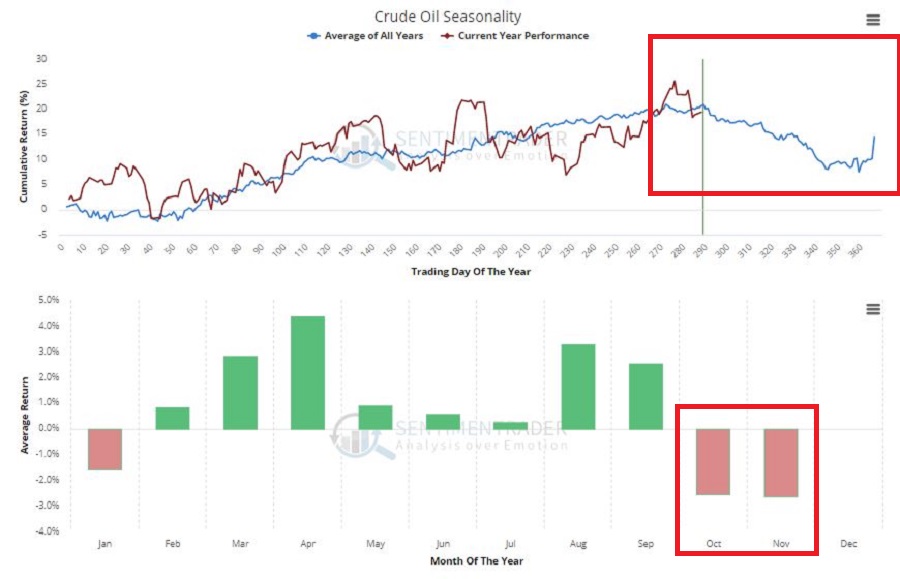
Figure 1 – Crude Oil annual seasonality: Courtesy Sentimentrader.com
If – and as I intimated, it is always a big “if” – this bearish seasonal trend exerts itself this year, then now would appear to be a good time to enter a bearish position in crude oil.
DISCLAIMER: For the record I am not “predicting” that crude oil will decline in the months ahead, nor am I “recommending” that anyone go out and play the short side of crude based solely on what I write there – including the “example” trade that appears below. JayOnTheMarkets.com is not an advisory service (it’s basically just the ramblings of a market-addled mind. I write about what I see – or think I see – and you take it from there – or not). The purpose of all of this is simply to highlight one potential way to take advantage of a particular seasonal trend.
Crude Oil Futures
The purest play would be simply to sell short crude oil futures and get point-for-point profit if crude oil declines in price. As you can see in Figure 2, crude oil futures recently hit a key resistance price and failed (at least so far) to break through.
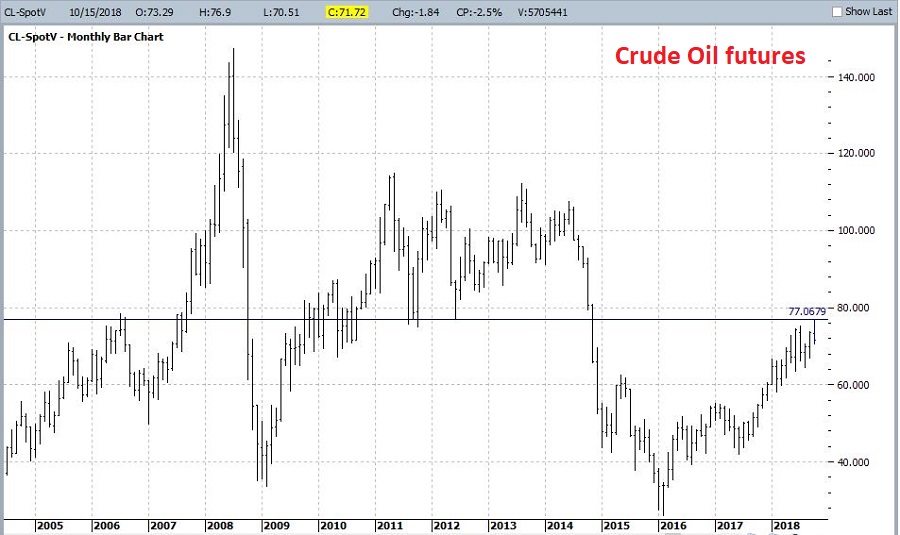
Figure 2 – Crude Oil futures: Courtesy ProfitSource by HUBB
While selling short crude oil futures is fine for well capitalized speculators, the reality remains that each $1 move in the price of crude oil results in a $1,000 change in contract value. So, if you sell short crude oil futures at $71.72 and instead of going down crude rallies back up to its previous high of $76.90, you lose over $5,000. Which is a little rich for the average investors’ blood.
United States Oil USO
Ticker USO is an ETF that ostensibly tracks the price of crude oil. You can see its price action in Figure 3. It hit a resistance point and reversed recently.
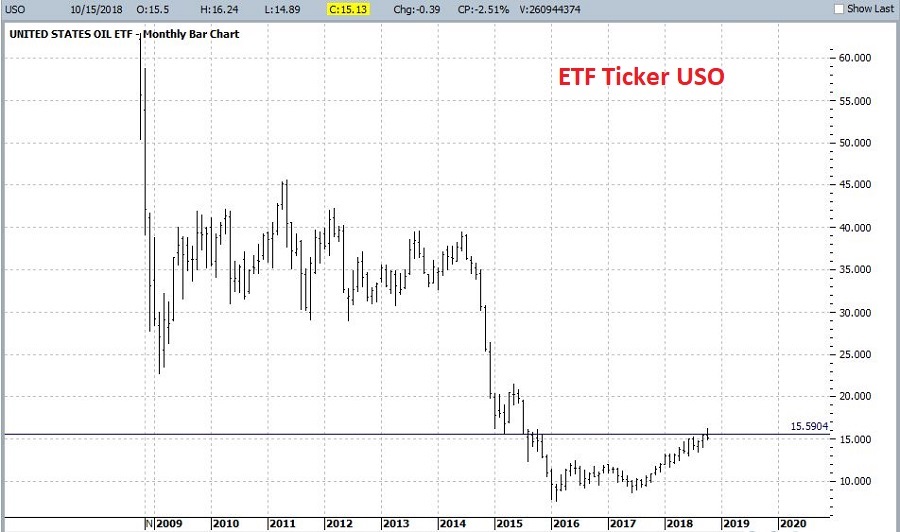
Figure 3 – ETF ticker USO: Courtesy ProfitSource by HUBB
Playing The Short Side
So, let’s say:
- We want to play the short side of crude oil
- We want as close to point-for-point movement as possible
- We don’t want the unlimited risk associated with selling short crude oil futures
What’s a trader to do? One possibility is to buy a deep-in-the-money put option on ticker USO. Figure 4 displays the particulars and Figure 5 displays the risk curves.

Figure 4 – USO put trade: Courtesy OptionsAnalysis.com
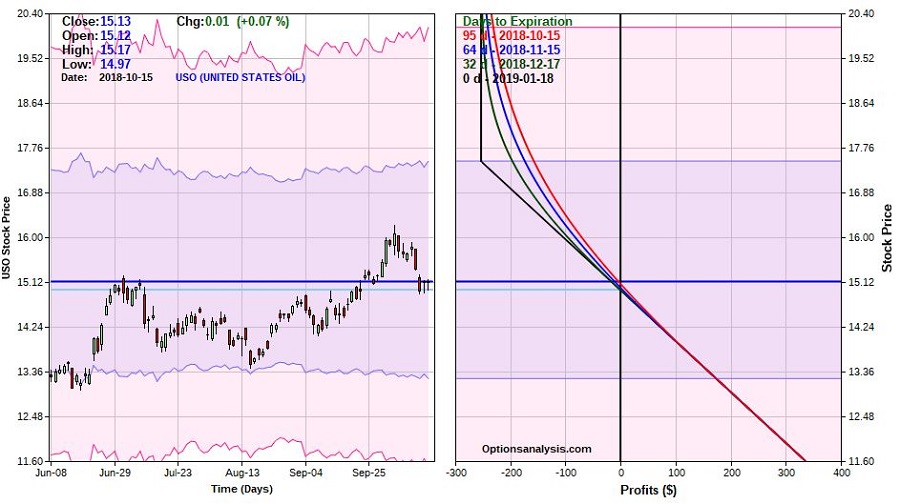
Figure 5 – USO put trade risk curves: Courtesy OptionsAnalysis.com
A few things to note:
- The maximum risk is $253 per 1-lot
- If USO drops from $15.13 to below $14.97 the put option gains value point-for-point for each lower tick in USO.
Let’s take a slightly closer look at this example trade. Figure 6 “zooms in” a bit – i.e., the lowest price on the chart is $13.20, which represents a 1-standard deviation move to the downside and the highest price is $16.40 which is above the recent high of $16.24. If USO takes out the recent resistance level the basis for the trade is sort of blown and it would likely be a good time to cut a loss.
- A move down to $13.20 would result in a profit of roughly +$176
- A move up to $16.40 would result in a profit of roughly -$97 to -$147, depending on how soon that price is hit.
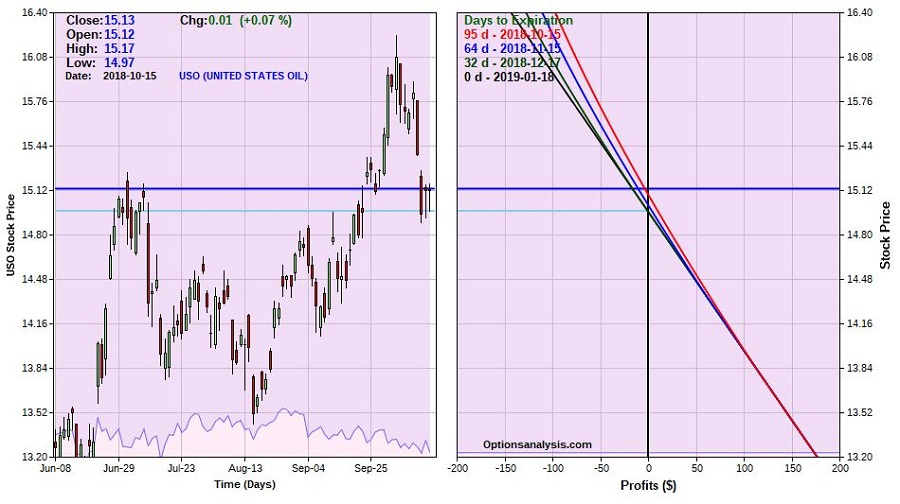
Figure 6 – USO example trade: Courtesy OptionsAnalysis.com
Summary
Will crude oil decline in the months ahead? I have to go with my stock answer of “it beats me,”. But seasonality and a failed upside breakout offers some basis for considering playing the short side.
While an in-the-money put option on USO offers far less profit potential than a short position in crude oil futures, it also entails a fair smaller degree of risk.
The key factors are:
a) Do you think there is a chance crude oil will decline in the months ahead?
b) Are you willing to enter a speculative position which could result in a 100% loss (if USO is above $17.50 at expiration)?
c) Do you have $253 bucks?
Disclaimer: The data presented herein were obtained from various third-party sources. While I believe the data to be reliable, no representation is made as to, and no responsibility, warranty or liability is accepted for the accuracy or completeness of such information. The information, opinions and ideas expressed herein are for informational and educational purposes only and do not constitute and should not be construed as investment advice, an advertisement or offering of investment advisory services, or an offer to sell or a solicitation to buy any security.
