Get 40% Off
🚨 Volatile Markets? Find Hidden Gems for Serious Outperformance
Find Stocks Now

A New Cluster Of Omens Betrays Bullish Case For Stocks

Published 02/12/2020, 04:44 PM
Updated 07/09/2023, 06:31 AM

I have written about the value of the Hindenburg Omen as a technical stock-market signal several times over the past few years. To summarize, while an individual signal has very little value in forecasting a stock-market crash, as some seem to suggest, a cluster of signals can be valuable in that it signals a pattern of dispersion that is not compatible with a healthy uptrend.

In the past, these clusters have marked important intermediate and long-term reversals. You’ll notice in the chart below that at both the 2000 and 2007 stock-market peaks there were a significant number of omens triggered during both a 3-month and 12-month window. We saw something similar in mid-2015 before a pair of sharp corrections. We saw another rising pattern in early 2018 leading into the “volmageddon” selloff and again later that year, just prior to the steep fourth-quarter decline in the broad stock market.
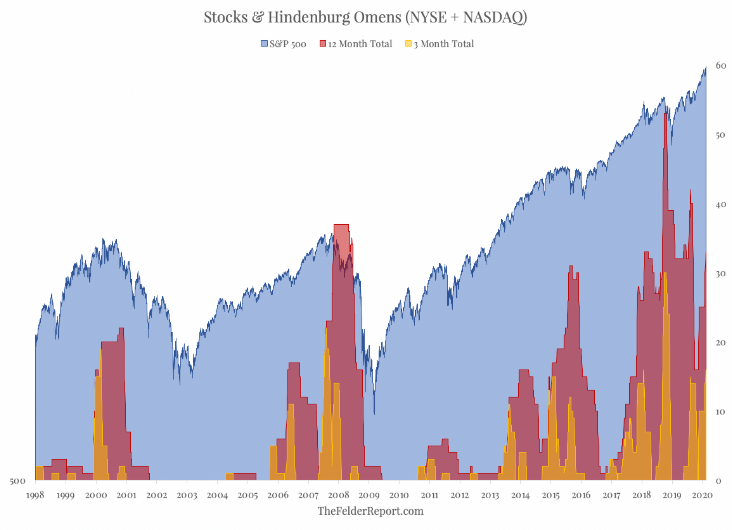
S&P 500 With 12- And 3-Month Totals

Signals

Over the past couple of weeks, we have seen another cluster of 8 individual signals between the NYSE and Nasdaq. This takes the 3-month total back up to 16 and the 12-month total back up to 33, levels which have proved significant over the past twenty years or so. Again, this doesn’t mean stocks are going to crash; it merely suggests the current uptrend for stocks is not as healthy as the bulls should hope. Furthermore, it does increase the probability of near-term reversal for the broad indexes.

Latest comments

what this guy's trying to say instead of all this complex stuff basically there's going to be a pull back. you don't need to go on and on and on and on boring us
One last thing bonds and oil never lie
The difference is he spot on correct right now. In my Ford decades of trading I have never seen worse irrational exuberance and fantasy world bullishness than I do now. And I am a bull. This is coming to a close within if not a couple of days. Corrections are completely normal during up trends. To not have one of 10% is so abnormal it’s not funny. At this point a 20% correction wouldn’t even be a big deal. 2909 the 200 day needs to be tested in the next few days. And it is going to be. The coronavirus unfortunately is the catalyst. And 15,000 new cases overnight and 250 deaths It’s pretty astonishing on top of the CDC warning Americans they know it’s already here. Don’t be greedy corrections are normal It’s not normal to not have one. And this correction is months past due if not longer. Not one percent not 2%. I’m talking about 10 to 15%. That is a correction. You are all brainwashed into free money and low interest rates which if the economy is so strong why do we need any of that?
if you flip a coin, heads or tail probability is always 50%. even if the coin lands heads 1000 times the next flip will still not be greater than 50%. that's why no one can predict the market on past performance
anyone can predict ir assume a market crash after such a long bull trend, then, "if" it happens they will be noticed as prophets.
Comparisons are meaningless because the central banks now print endlessly.
Risk Disclosure: Trading in financial instruments and/or cryptocurrencies involves high risks including the risk of losing some, or all, of your investment amount, and may not be suitable for all investors. Prices of cryptocurrencies are extremely volatile and may be affected by external factors such as financial, regulatory or political events. Trading on margin increases the financial risks.
Before deciding to trade in financial instrument or cryptocurrencies you should be fully informed of the risks and costs associated with trading the financial markets, carefully consider your investment objectives, level of experience, and risk appetite, and seek professional advice where needed.
Fusion Media would like to remind you that the data contained in this website is not necessarily real-time nor accurate. The data and prices on the website are not necessarily provided by any market or exchange, but may be provided by market makers, and so prices may not be accurate and may differ from the actual price at any given market, meaning prices are indicative and not appropriate for trading purposes. Fusion Media and any provider of the data contained in this website will not accept liability for any loss or damage as a result of your trading, or your reliance on the information contained within this website.
It is prohibited to use, store, reproduce, display, modify, transmit or distribute the data contained in this website without the explicit prior written permission of Fusion Media and/or the data provider. All intellectual property rights are reserved by the providers and/or the exchange providing the data contained in this website.
Fusion Media may be compensated by the advertisers that appear on the website, based on your interaction with the advertisements or advertisers.
© 2007-2024 - Fusion Media Limited. All Rights Reserved.