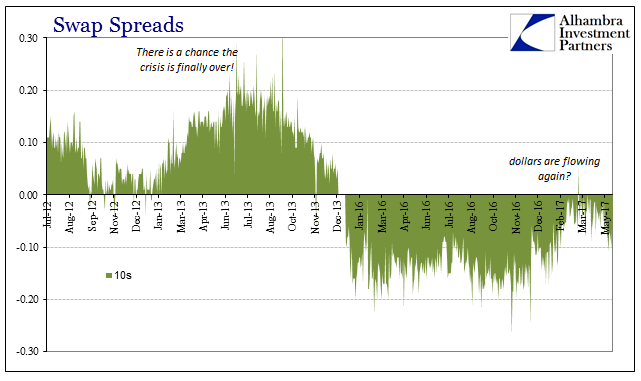
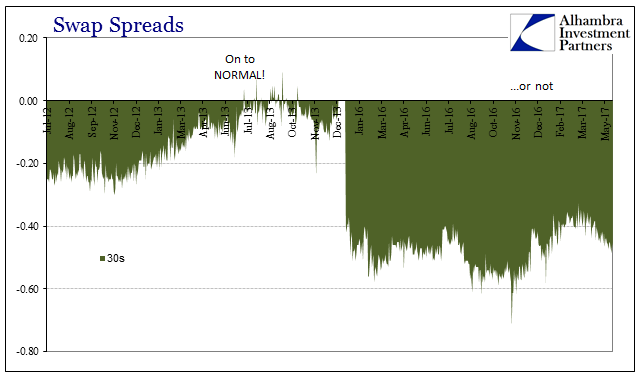
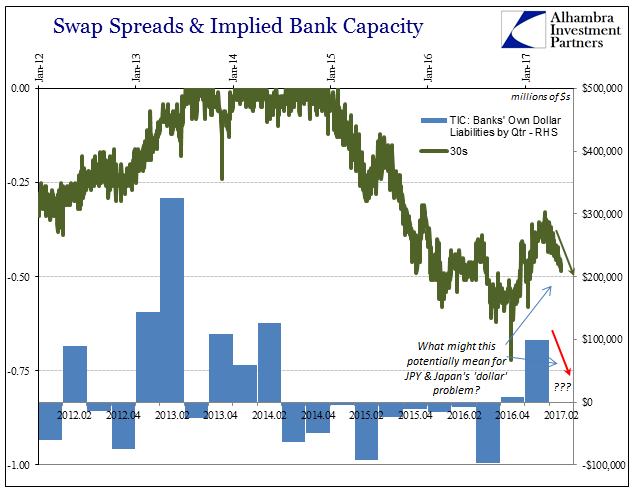
I don’t pay much attention to the 2 year part of the UST curve because I think it is susceptible to information spoilage, distortions that aren’t strictly related to what a “risk-free” 2s should tell us. But as my colleague Joe Calhoun often reminds me, just because I don’t think it as important doesn’t mean that other people see in the same way; and if enough other people do, then it becomes market-worthy information. So be it.
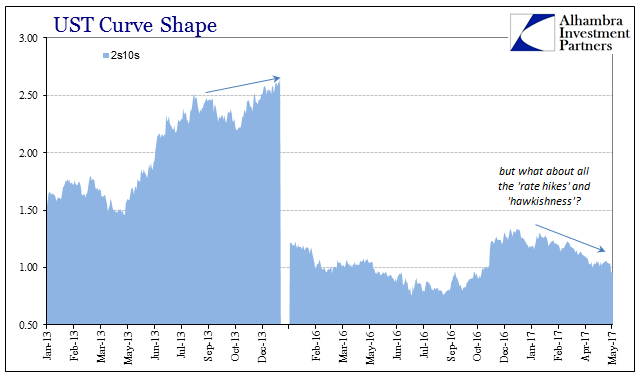
The 2s10s part of the yield gets just that much attention but more so in trying to find inversion and therefore recession. I doubt we would ever get something like that in these circumstances, recession or not. But there is something about the 2s10s perhaps in “reflation” that might be instructive at least related to enthusiasm or sentiment.
It was this part of the yield curve more than any other that expressed “reflation.” The 5s10s, the part I focus more so on, traded in some mild sympathy with it while the 5s30s didn’t even notice. The 2s10s, by contrast was almost enthusiastic about the prospect, especially during the bond selloff last November. It was, in fact, this part of the yield curve that put that liquidation in something of a positive light as if “rate hikes” would mean what they were supposed to mean in 2014.
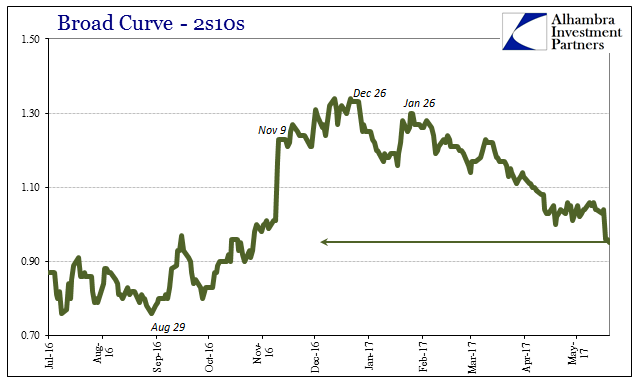
After trading this week, however, the 2s10s is back in shape to where it was before the liquidation, less than even the start of 2016 and nearing the level of the more wretched interpretations from the middle of last year. If we take this as a measure of sentiment rather than recession or not, it’s possibly an important one telling us about the state of “reflation.”
This is, of course, nothing we haven’t witnessed before. It does so look like 2014 all over again and in so many ways. The big difference is obviously that this “reflation” is much, much less than even that one; which was itself less than the one before it.
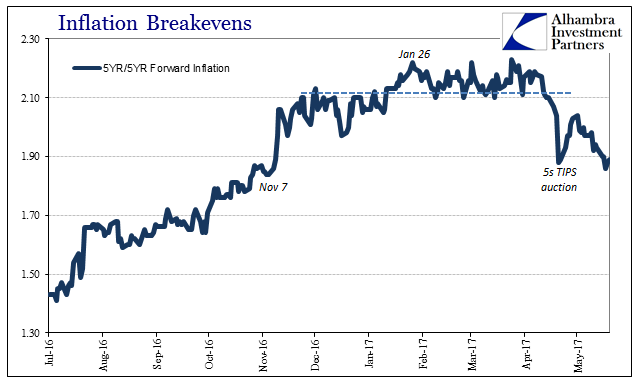
Even the 5-year/5-year forward inflation rate has been knocked from its low-hanging perch, done in by that TIPS auction in the same way as in, again, 2014. Like the 2s10s, the forward inflation rate was of the more enthusiastic variety of economic considerations, maybe expanding too far out of line with oil.
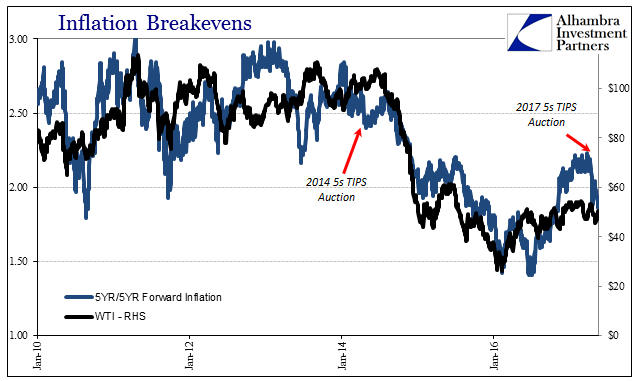
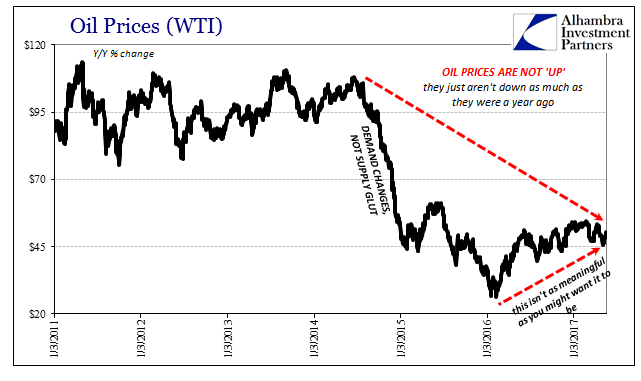
Then, again, “everyone” believed oil was on its way back to $100 eventually, not stalled and under repeated liquidation pressure at $50. You can get the sense of misreading the fundamental prospects represented by the oil price rebound and what that might have meant for wider circumstances. In other words, as I wrote before, oil prices aren’t actually up now, they are just not down as much as last year.
The world can’t just ignore that circumstance, not the least of which is because it is everything right now. The global economy gets knocked down by these “dollar” events and never gets all the way back up. The “rising dollar” was for much of it the worse one yet, in some places (Brazil as well as China) more destructive than even the Great “Recession.”
Maybe that is why the 2s10s considered mildly “reflation” potential while all the rest, the considerable rest, really never did. To put it in “dollar” terms, “dollar” pressure may have abated somewhat, but it remains to some substantial degree nonetheless, always behind everything. To my mind, that meant unless something actually did change, meaning in monetary conditions rather than just some rewarmed “stimulus” of tax cuts and rebuilding bridges and highways, “reflation” truly never had a chance. I don’t think we can say markets are quite at that interpretation just yet, but they have been inching in that direction for some time now. Even 2s10s, FWIW.
