You know what's really scary? When everything stops working. No, not when the world on balance grinds to a halt; rather when tried and true analytical signals become less reliable across our major markets mix to which we oft refer as BEGOS (Bond / Euro / Gold / Oil / S&P). A few missives back, we made mention (in thinking of those of you who read the website's daily "Prescient Commentary") of our nixing various Market Rhythms Targets after they've generated signals.
This phenomenon continues to be the case of late: without combing through the verbiage of our daily comments to count the number of failed signals, doubtless in memory have we ever gone through a period as we've recently seen wherein there've been more Targets nixed than met. Our Market Rhythms page, also updated each day, continues to list those technical studies which -- through the benefit of testing hindsight -- have been sporting the best recent signaling reliability; but over the past few months, quite a number of the signals have lacked follow-though to their Targets. (And own up out there, for we very much doubt we're alone). Moreover, the number of signals posted each day typically is around 20; presently, just 12 are meeting our rigid criteria. Stuff has stopped working.
So our thinking is "when everything stops working", that in turn is generating a more overall, broad-based foreboding Gold-positive danger signal: that major markets' present states are sufficiently out of sorts, their ebb and flow of trading as ripe with uncertainty as ever. For in addition to currency debasement, Gold also grooves on uncertainty. And from our purview, the scariest uncertainty of all remains the stock market. As we've herein hearkened time and again, the S&P 500 is supported neither by its moneyflow, (of which the dollar amount to move the Index one point has thinned to its lowest levels over 10 years), nor by its individual components' earnings per share, (our "live" price/earnings ratio at this writing a whopping 40.3x).
And yet, the S&P continues to endlessly levitate, such to colour it as "diabolical" is understatement. (And 'tis to laugh: the S&P lost 1.0% yesterday [Friday] in settling out the week at 2096; but in sauntering past the perma-FinTV at the club, you'd think that the world had come to an end, the on-screen chyron in front of the agitated anchors and analysts reading "Global fear hits stocks". Jeepers, were it to have been twice as bad at -2.0%, surely a white-coated brigade would have been called in to drag everyone off the set). The point is: Gold looks good when all else goes gamy.
Not that our analytics have ground to a complete halt; those technical studies that qualify for our Market Rhythms page still -- again in hindsight -- are posting fairly impressive results; but as above noted, the daily listing of Rhythms meeting our criteria has really been pared down of late, again supporting the Gold-positive danger signal.
And given the yellow metal's having nicely firmed throughout this past week, perhaps more widespread is becoming the revelation (finally) that Gold is not just something to hold, but given 'tis well-oversold, 'tis again time to step up, buy and be bold. For there's no doubt about it, (and talk about a whirl 'round, can we actually be saying this?): Gold is finding it difficult to stay down these days. What in recent years has been "Oh no, there it goes again..." is morphing into "Wait! It's comin' all the way back up!" Yup.
And that's just what we are seeing via Gold's weekly bars. In fact, Gold's fortnight gain of 64 points is its third best two-week rise year-to-date. As for those out there in their Gold Shorts under the guise of the declining parabolic red dots, how's that wedgie workin' out for ya, eh?

Of technical import as well is Gold's having drilled back up through the entirety of the purple-bounded 1240-1280 resistance zone as it did from this past Tuesday into Friday. Here 'tis by the hour:
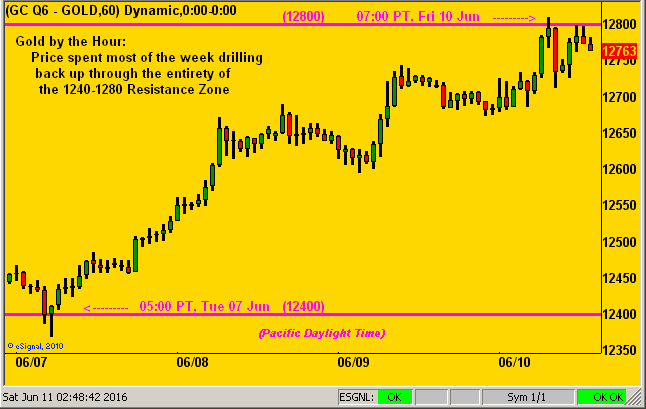
'Course, with respect to Gold's rising, with various of our recent signals across the BEGOS markets failing, there is much about which to be uncertain. This coming Wednesday (15 June) we've the Federal Open Market Committee's policy statement and Chair Yellen press conference, followed a week Thursday (23 June) by the United Kingdom's referendum on Brexit, aka "Should I Stay or Should I Go"--(The Clash, '82).
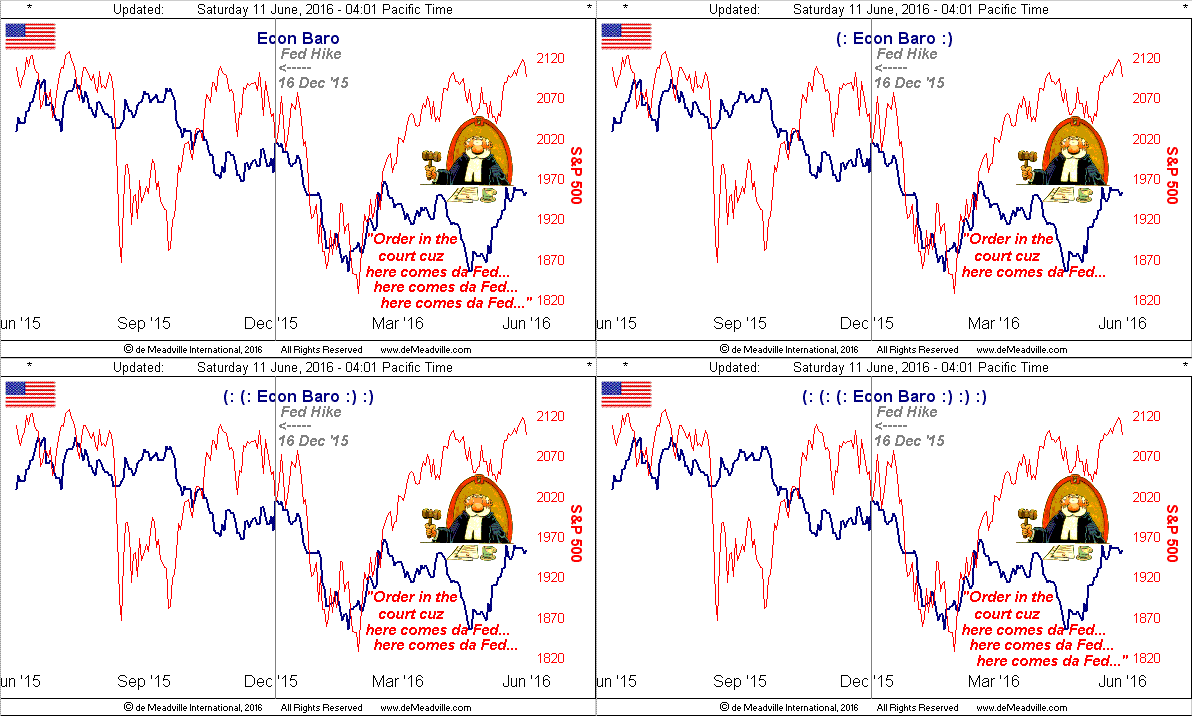
Specific to the FOMC, voting member and Federal Reserve Bank of Boston President Eric Rosengren wants to first determine if the weak payrolls data for May was but a one-time-wonder, (so that's likely an abstention from raising the FedFunds target rate right there). Still, the Fed Chair during last week's Philly Phollies suggested the economy is continuing to strengthen, the slowing payrolls growth notwithstanding, such that it can absorb gradual increases in borrowing costs. That may be, Aunt Bea, (thank you PG), but as you below see, the overall level of our Economic Barometer is lower than 'twas following your bank's rate hike last December, in spite of the recent Econ Baro up stint:
Meanwhile, debt does not feel any Fed threat. Have you been watching Bond prices of late? ![]() "Higher and higher and higher they climbed..."--(Bob Seger, "Hollywood Nights", '78). Meaning, of course, that yields are moving lower. How low are they? The yield on our 30-year Treasury Bond is presently 2.447% -- that is mere pips away from the lowest 'tis yielded in recent decades: 2.226% in January 2015 -- and that yield's trend, as you can below see, continues down as charted from 23 years ago through yesterday's close:
"Higher and higher and higher they climbed..."--(Bob Seger, "Hollywood Nights", '78). Meaning, of course, that yields are moving lower. How low are they? The yield on our 30-year Treasury Bond is presently 2.447% -- that is mere pips away from the lowest 'tis yielded in recent decades: 2.226% in January 2015 -- and that yield's trend, as you can below see, continues down as charted from 23 years ago through yesterday's close:
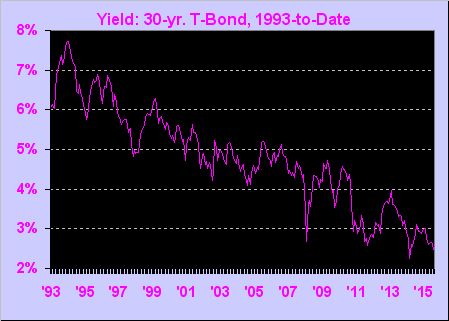
And 'tis not just StateSide. As one FinMedia headline quipped this past week, "Bond yields fall across the globe; Yields on German and Japanese bonds touch new lows". Makes sense to us, given the overall downtrend of the Econ Baro, Japan delaying its sales tax increase, China's falling exports (-4.1% in May), Germany's jilted factory orders (-2.0% in April), the European Central Bank's new corporate bond buying binge, and the potential of Brexit Wrexit.
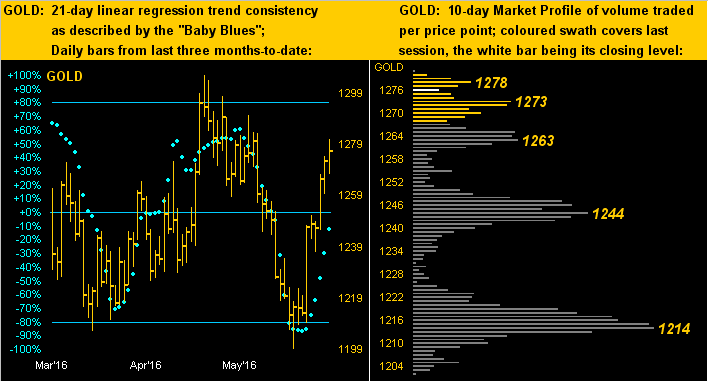
'Course, avoiding "The Wrecking Crew" --(Dean Martin, Elke Sommer, Columbia Pictures '68 ... and a "must see" if you're a Gold aficionado), are the Precious Metals. In the below two-panel graphic, we've Gold's daily bars for the past three months-to-date on the left, and the 10-day Market Profile on the right. Gold's baby blue dots depicting 21-day linear regression trend consistency are ascending with alacrity and are only just reaching their 0% axis; that said, you can see all the price bunching mid-chart, representative of the struggles Gold has had at the top of the 1240-1280 resistance zone and Neverland (aka 'The Whiny 1290s"). Meanwhile the trading supporters still stand stark in the Profile:
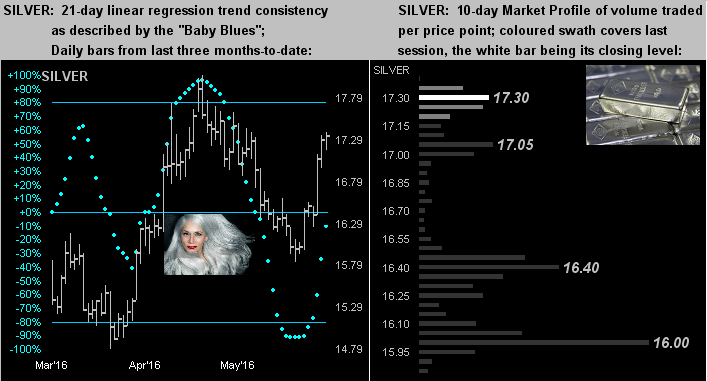
Now the same drill for Sister Silver, who clearly is adorned in her precious metals pinstripes. How do we know that? Because were she instead wearing her industrial metal jacket, she'd be in full plunge along side Cousin Copper, which has lost 11% of its value from the beginning of May ($2.29/pound) through yesterday ($2.03/pound). Should Silver break out above the low $18/oz. area, her door opens up to regain $20/oz., a level not traded since 04 August 2014.
Prior to parting with a few final notes, here is the State of the Stack:
The Gold Stack
Gold's Value per Dollar Debasement, (from our opening "Scoreboard"): 2587
Gold’s All-Time High: 1923 (06 September 2011)
The Gateway to 2000: 1900+
Gold’s All-Time Closing High: 1900 (22 August 2011)
The Final Frontier: 1800-1900
The Northern Front: 1750-1800
On Maneuvers: 1579-1750
The Floor: 1466-1579
Le Sous-sol: Sub-1466
Base Camp: 1377
Year-to-Date High: 1306 (02 May)
Neverland: The Whiny 1290s
The Weekly Parabolic Price to flip Long: 1290
10-Session directional range: up to 1281 (from 1202) = +79 points or +7%
Resistance Band: up to 1280 (from 1240)
Trading Resistance: 1278
Gold Currently: 1276, (weighted-average trading range per day: 17 points)
Trading Support: 1273 / 1265-1263 / 1246-1244 / 1214
10-Session “volume-weighted” average price magnet: 1238
The 300-Day Moving Average: 1167
Year-to-Date Low: 1061 (04 Jan)
We thus leave you with these three quickies:
■ Beyond Brexit? Regardless of whether 'tis voted in to get out, or 'tis voted out to stay in, sentiment has swung a bit more toward getting out, albeit the lines at the betting parlours are still quite "odds-on" that the UK shan't go away. That said, the European Union is not gaining popularity, which has had marked reductions from 69% (in '04) to now 38% in France, and from 80% (in '07) to now 47% in Spain. Given the reinvention of Europe's political ideologies and geographic borders from one generation to the next, Brexit may appear but wee in the rear-view mirror over the ensuing months/years. Hang onto your Gold.
■ Bob Iger, the chief executive overseer of all things Mickey Mouse, says high corporate taxes are "anti-competitive", the tax system is "ridiculously complex", the loopholes ought be shut, and the base lowered. Bonne Chance, mon ami. But 'tis stifling stuff even at the level of us individuals: our "tax freedom day" this year was 24 April; almost four months of all that one gained gone to government. A U.S. Census Bureau report from last year pegged over 50 million folks as being on major assistance programs per 2012 data. There are calculations today placing the number of assistees at over 100 million. Gotta have that tax revenue!" Further, the Bureau of Labor Statistics claims 122 million folks have full-time jobs as of this past April. But given the growing amount of people leaving the workforce, those numbers (rising assistees vs. falling workforce) are trending to pass one another. Hang onto your Gold.
■ Regardless of how, if at all, you view George "Superman or Scalawag" Soros, word has it that at the energetic age of 85, he was back in the office last quarter "directing bearish trades", but also buying Gold and mining shares. One wonders if 'tis he who's been "fading" our Market Rhythm Target signals, thus instigating our overall Gold-positive danger signal. Either way, he's not stupid. Hang onto your Gold.