- A Moment Of Excitement
- Gold – Still No Buy
- No…Not Everyone Was Wrong On Bonds
- Market & Sector AnalysisC
- 401k Plan Manager
- April 20, 2017 – Why Bonds Aren’t Overvalued
- March 23, 2017 – The Long View – Rates, GDP & Challenges
- A decline in savings rates to extremely low levels which depletes productive investments
- An aging demographic that is top heavy and drawing on social benefits at an advancing rate.
- A heavily indebted economy with debt/GDP ratios above 100%.
- A decline in exports due to a weak global economic environment.
- Slowing domestic economic growth rates.
- An underemployed younger demographic.
- An inelastic supply-demand curve
- Weak industrial production
- Dependence on productivity increases to offset reduced employment
Review & Update
After almost two months of an “eerie” calm, the markets hit some turbulence last week. While “fake news” from the media has become quite a common occurrence as of late, the latest batch came courtesy of the New York Times. As I penned on Friday:
“As suspected, it did end with a bang on Wednesday as markets dropped sharply on the news of a “leaked” memo to the New York Times which suggested an attempted ‘obstruction of justice’ charge by the President. James Comey, former head of the FBI, will now be questioned by Congress next week and asked to provide that memo. In the meantime, the Justice Department has now appointed a special prosecutor to investigate the “Russia Connection.”
As I discussed on “The Lance Roberts” show on Thursday and Friday, such a memo is unlikely to actually exist, and even if it does, is likely to be innocuous at best. Comey would potentially have a high degree of liability considering he already has stated, under oath, that he was not aware of any such attempt to impede an investigation. Perjury is a serious issue.
The problem for the Washington Post, The New York Times, CNN, and other major media outlets, the rush to try and “pin the tail on Trump,” has led to a consistant dump of #FakeNews which continues to impugn the journalistic integrity of those institutions.
However, while the Washington intrigue is certainly interesting, the question is “why after all these months did it matter to the markets now?”
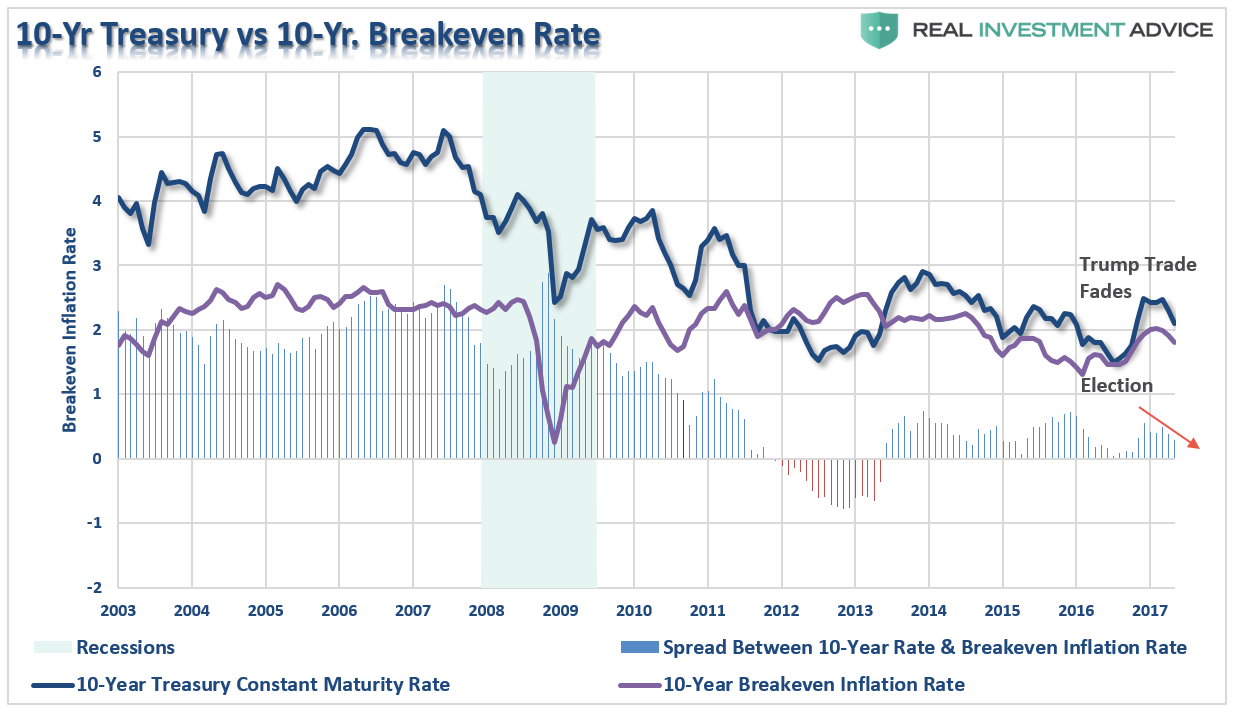
The answer is simple. It potentially stalls all the legislative actions the markets have been banking on for the “Trumpflation” trade from tax cuts to infrastructure spending. A look at the bond market gives you a clearer picture of the “fading” hopes on an inflation-driven economic boom.
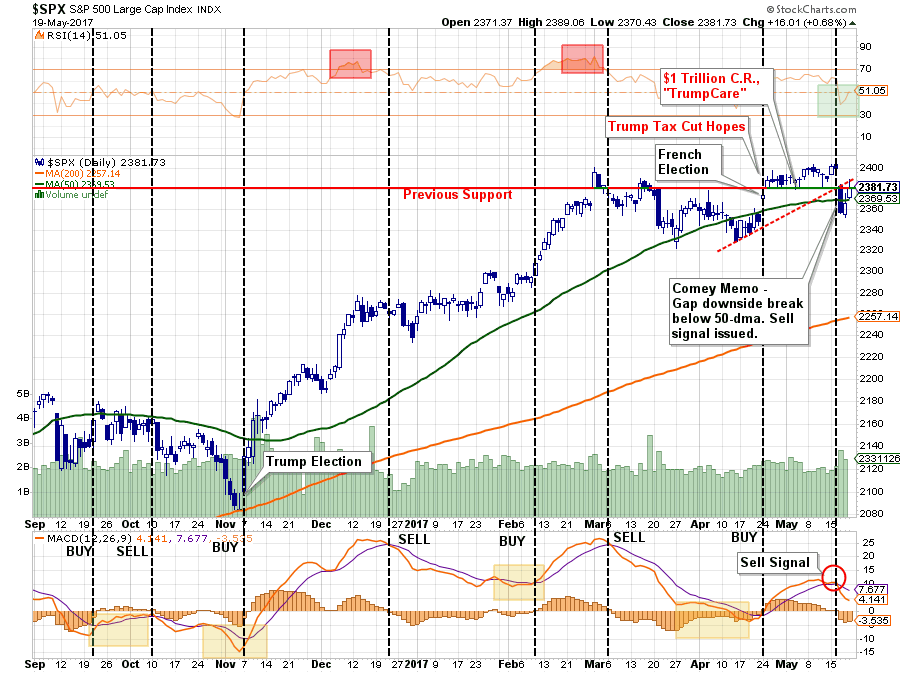
Importantly, as shown below, the market quickly recovered from Wednesday’s sell-off and remained above the 50-day moving average for the week.
That’s the good news
The not so good news, in the short-term, is the daily “SELL” signal was triggered (lower panel) which often denotes periods of increased volatility and corrective actions until they are complete. Despite the rally on Thursday and Friday, I suspect the “shot across the bow” on Wednesday was just that and suggests reflexive rallies should be used to rebalance and de-risk portfolios for now.
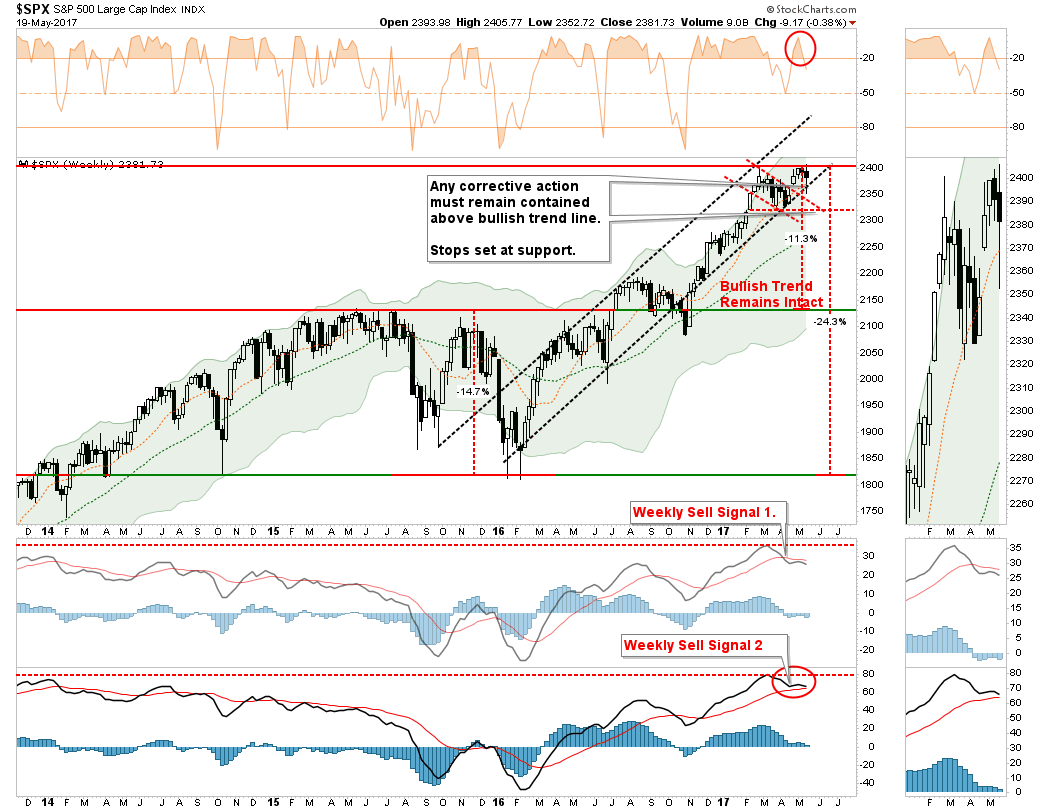
However, as shown below, on a longer-term basis the backdrop is more indicative of a potential correction rather than a further advance. With the initial intermediate-term (weekly) “sell” signal triggered at historically high levels, the downside risk currently outweighs the potential for reward…for now. Furthermore, the secondary (lower) weekly “sell” signal is also very close to triggering from an extremely high level as well.
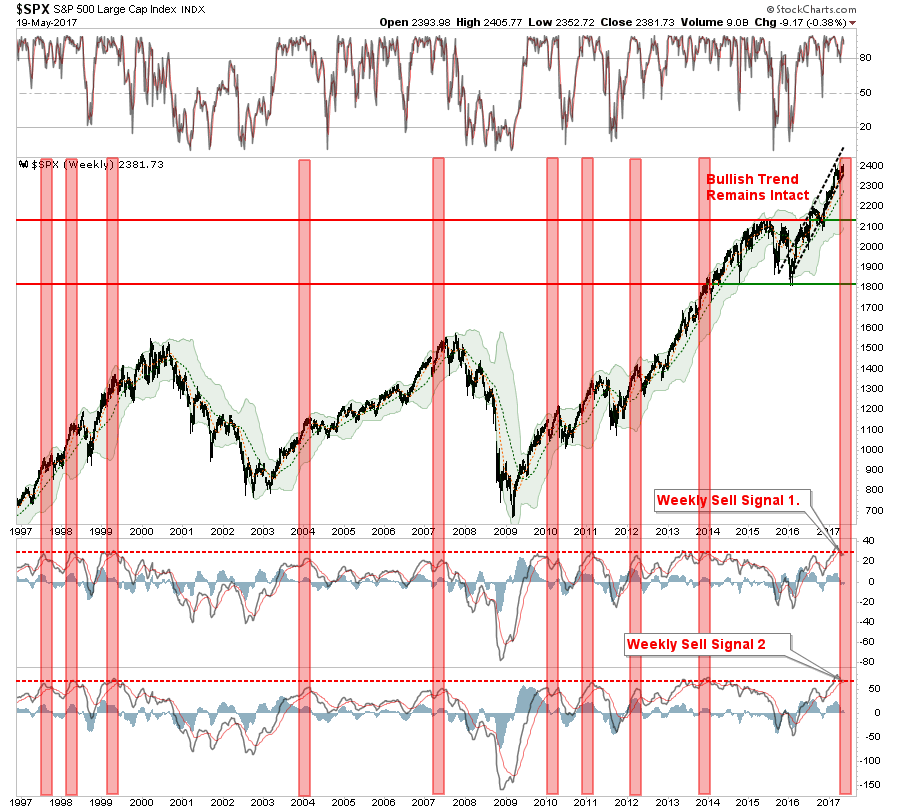
For a bit of context, the chart below shows the 20-year history of the market with the combined weekly “sell” signals. The vertical red shaded bars highlight the periods when both weekly “sell” signals were triggered from very high levels as we are currently at risk of doing.
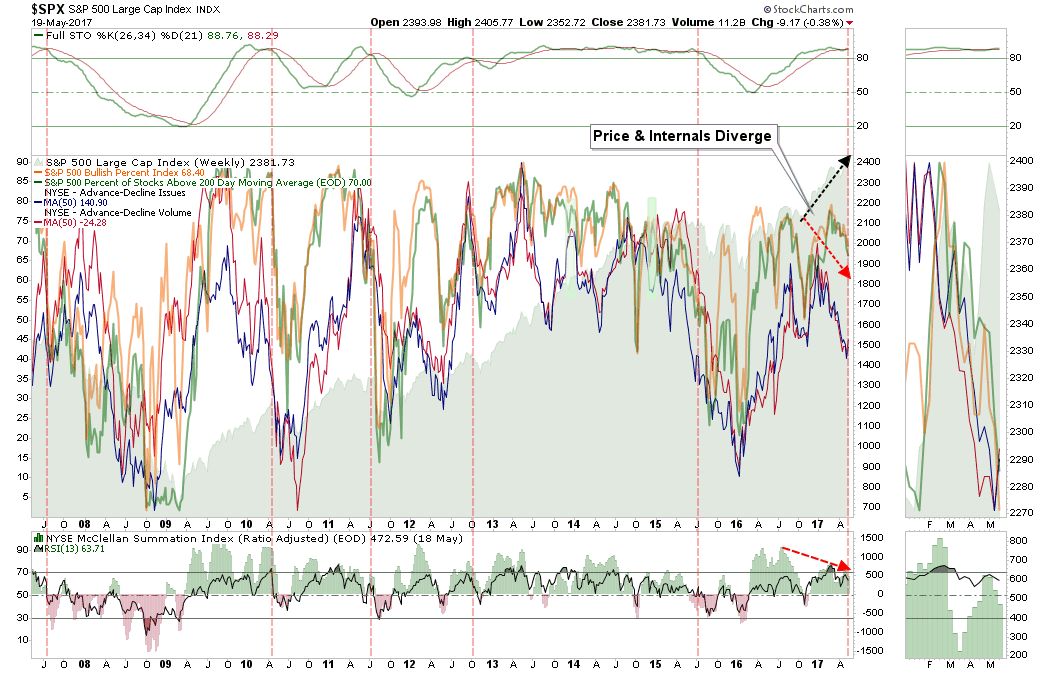
Furthermore, the underlying internal have continued to weaken over the last week which has remained a concern over the last couple of months.
The 10-year chart below, while a bit cluttered, shows several very important things worth considering currently. First, the top part of the weekly chart is essentially a buy/sell indicator. Each sell signal previously, has been indicative of a correction. The middle of the chart is a combination of internal strength indicators from the number of stocks on bullish buy signals, advancing vs declining issues and volume, and the percent of stocks above their 200-day moving average.
With all the internal indicators currently on the decline, when combined with a stochastic “sell signal,” there is a higher probability of a correction in the weeks ahead. While this time could certainly be different, it is probably worth noting that making such a bet with your retirement money has not often ended well.
Rich Breslow summed the current environment up well on Friday:
“Markets can trend, range trade, and correct. But one thing they can’t do under the current scenario is time-correct. The minute they stop moving, a powerful, even if short-lived, impulse takes over to reevaluate, cherry-pick and average down. Even if you’re sure the story hasn’t run its course, it takes real moxie to remain exposed to the other side of trades you were very comfortably holding for the previous weeks and months.
We’re all leery of getting caught in over-crowded trades. Nothing feels more teeming than new trades predicated on emotion. Even if you feel very strongly about the subject. This is a be nimble, very nimble, environment when we’ve been rewarded time and again for buying and holding. Traders will need skills that have atrophied over years. Another reason we are years away from ‘normal.'”
I suspect he is right.
Gold – Still No Buy
Back in early 2013, I made a recommendation to sell gold entirely and move into stocks.
The call was an easy one to make. Ben Bernanke had just kicked off QE3 in fear of the impact from the “fiscal cliff” and $85 Billion a month was pouring into the market from the Fed.
Importantly, QE IS NOT INFLATIONARY, because it is an asset swap and does not increase the money supply. This is why there has never been an inflationary push in the economy, nor much of an economic recovery either. This is because such monetary interventions remain primarily bottled up on Wall Street and acts as a “wealth transfer” mechanism between the bottom 80% of the population and the top 20%.
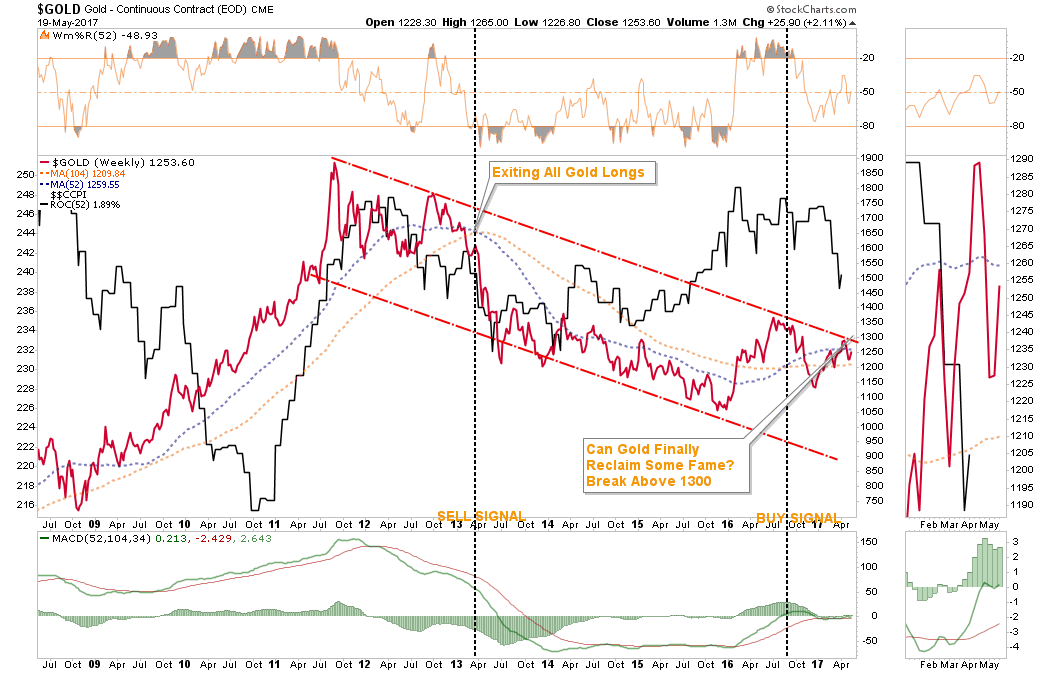
Currently, inflationary pressures have quickly subsided, as expected, due to the stabilization and fall in oil prices, despite the Fed’s belief the pickup was from economic resurgence. The problem with the pickup in inflation from oil prices is that it crimps consumer spending as we have seen as of late in weak retail and personal consumption expenditure reports.
With the inflationary backdrop fading, and gold prices still trapped within a major downtrend, there is NO REASON to own gold in portfolios as of yet. The recent trading opportunity, discussed several weeks ago in this missive, has been closed out due to the failure at resistance.
If, and when, gold breaks above $1300/oz, and confirms the breakout, we will add the metal to portfolio allocation models.
For now, the best return on gold is still coming from giving jewelry to your spouse simply “because.”
Trust me, the return on THAT investment will far exceed any other.
“Gold Bugs” need to remain patient for now.
No…Not Everyone Was Wrong On Bonds
A recent article out this past week by Russ Koesterich via BlackRock noted that bond yields had not melted-up as “everyone expected.”
Sorry, Rick.
It’s not everyone, just you guys on Wall Street.
Since 2013, I have been laying out the case, repeatedly, as to why interest rates will not rise. Here are a few of the most recent links for your review:
As I said, I have been fighting this battle for a long-time while “everyone else” has remained focused on the wrong reasons for higher interest rates. As I stated in “Let’s Be Like Japan:”
“Yellen has become caught in the same liquidity trap as Japan. With the current economic recovery already pushing the long end of the economic cycle, the risk is rising that the next economic downturn is closer than not. The danger is that the Federal Reserve is now potentially trapped with an inability to use monetary policy tools to offset the next economic decline when it occurs.
This is the same problem that Japan has wrestled with for the last 20 years. While Japan has entered into an unprecedented stimulus program (on a relative basis twice as large as the U.S. on an economy 1/3 the size) there is no guarantee that such a program will result in the desired effect of pulling the Japanese economy out of its 30-year deflationary cycle. The problems that face Japan are similar to what we are currently witnessing in the U.S.:
The lynchpin to Japan, and the U.S., remains interest rates. If interest rates rise sharply it is effectively “game over” as borrowing costs surge, deficits balloon, housing falls, revenues weaken and consumer demand wanes. It is the worst thing that can happen to an economy that is currently remaining on life support.”
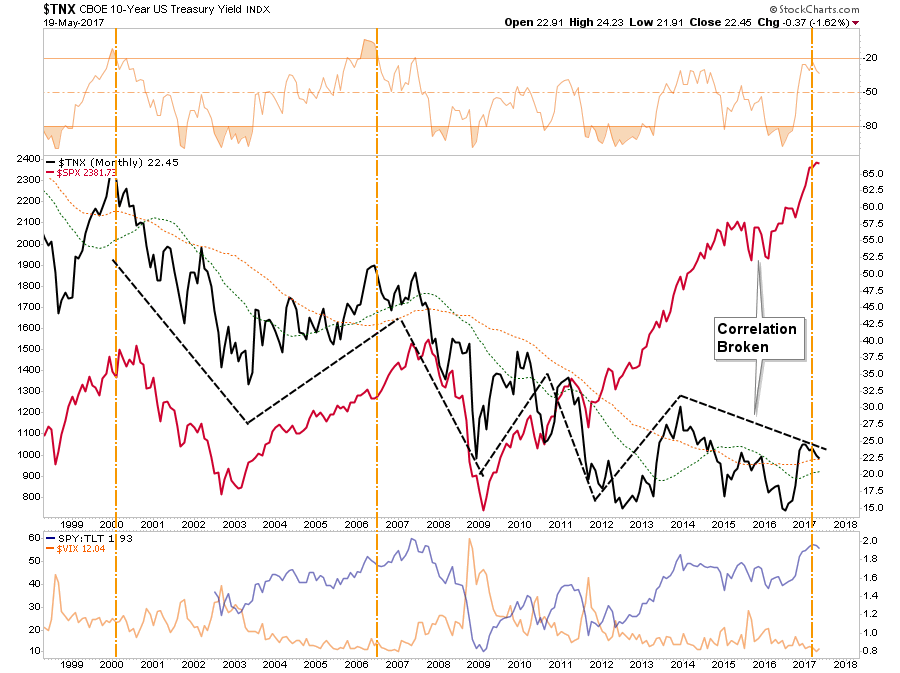
While Central Banks continue to intervene where possible to support asset prices, the recent decoupling of the market from the underlying rate structure, in hopes of “Trumponomics,” is likely transient. The only question is simply how long it will be before “reality” and “hope” reconnect.
The last time the stock/bond ratio (purple line) was this elevated, it didn’t work out well for investors as volatility spiked, equity prices plunged and the “sprint for safety” send bond prices surging.
Unfortunately, the Fed is still misdiagnosing what ails the economy and monetary policy is unlikely to change the outcome in the U.S., just as it failed in Japan. The reason is monetary interventions, and government spending, don’t create organic, and sustainable, economic growth. Simply pulling forward future consumption through monetary policy continues to leave an ever growing void in the future that must be filled. Eventually, the void will be too great to fill.
But hey, let’s just keep doing the same thing over and over again, which hasn’t worked for anyone as of yet, hoping for a different result.
What’s the worst that could happen?
See you next week.
Market & Sector Analysis
Data Analysis Of The Market & Sectors For Traders
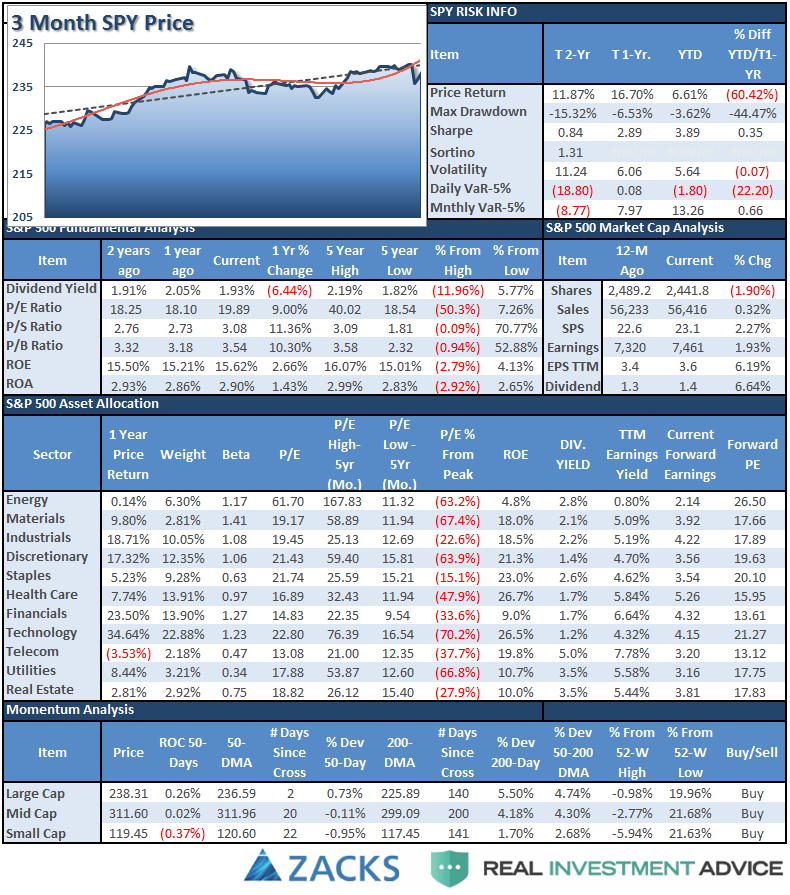
S&P 500 Tear Sheet
The “Tear Sheet” below is a “reference sheet” provide some historical context to markets, sectors, etc. and looking for deviations from historical extremes.
If you have any suggestions or additions you would like to see, send me an email.
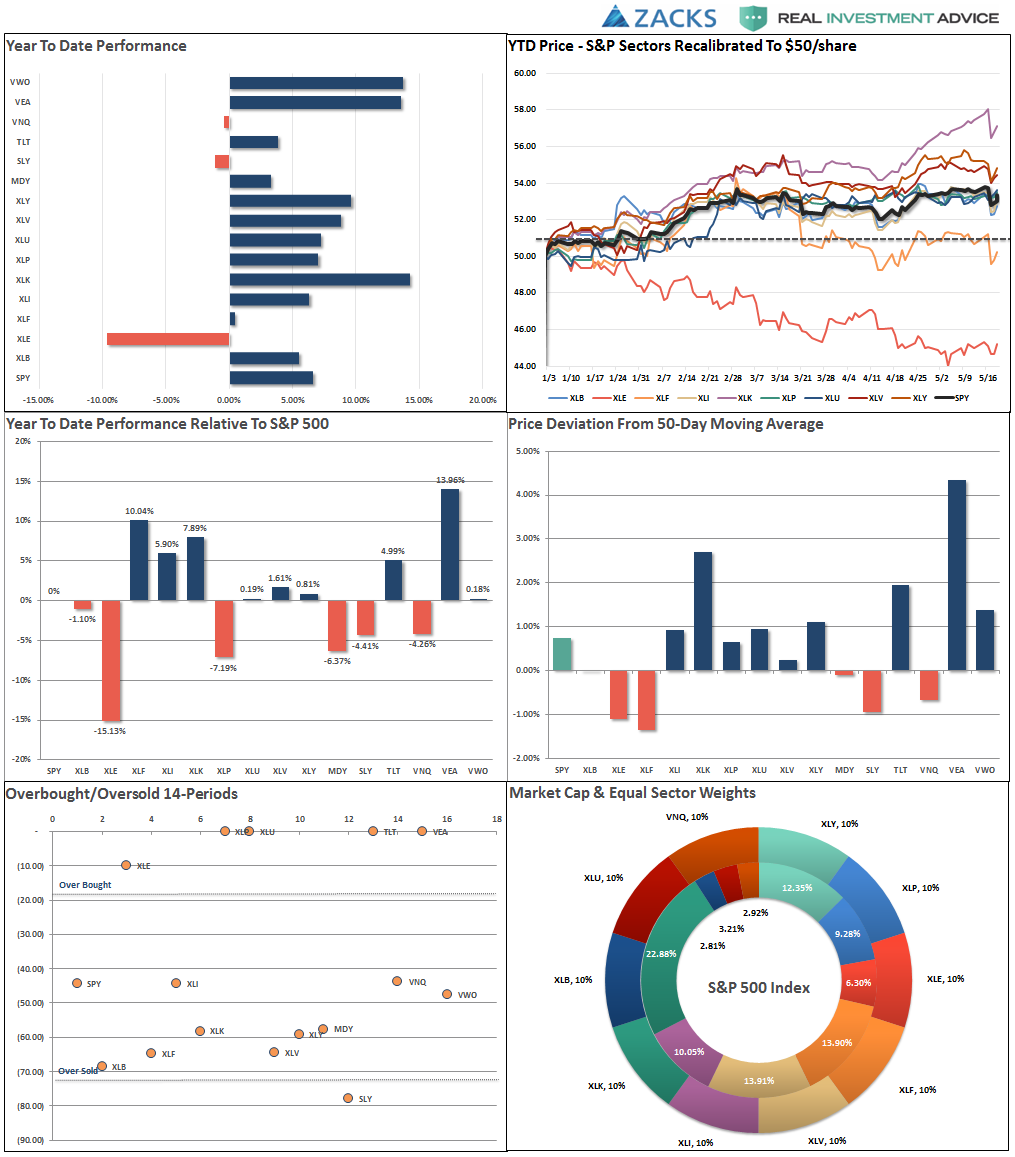
NEW! Performance Analysis
Sector Analysis
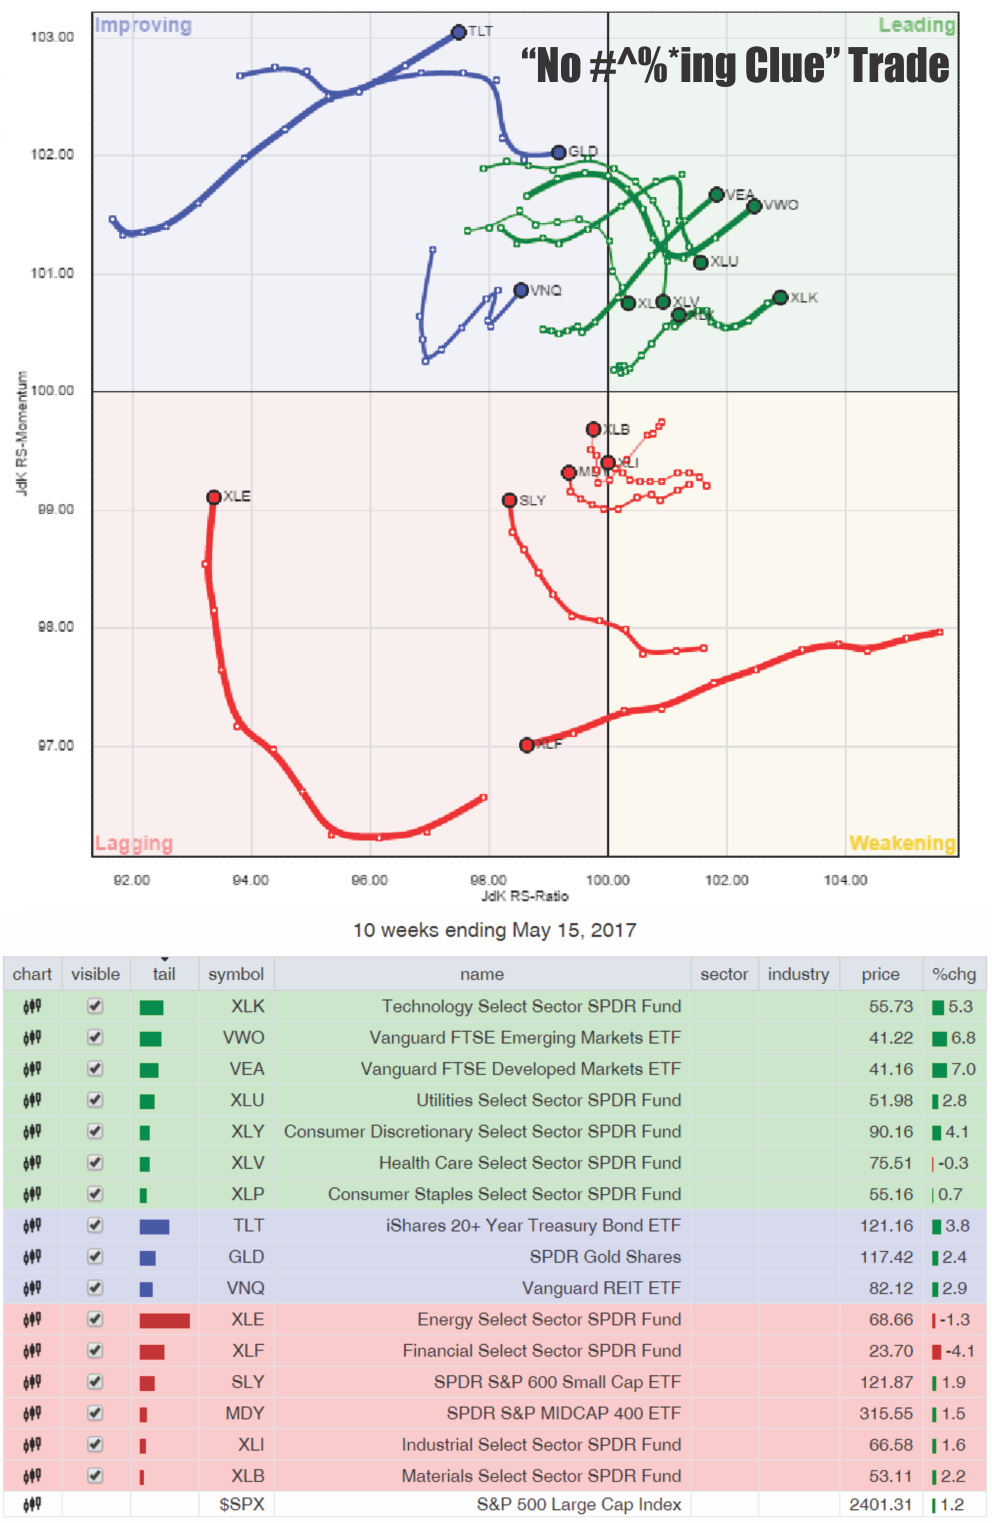
Last Tuesday, I discussed the sector rotation model and the inherent level of confusion currently. (For the series of charts leading to the one below, click here)
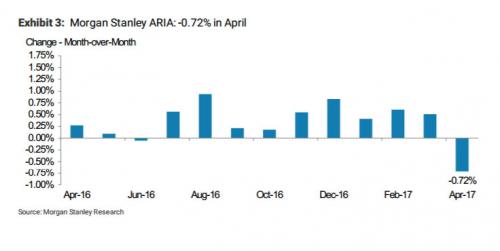
“Now, a new problem has emerged, “confusion.” With time wearing on, the hopes of a swift reform of the tax code, which would be the primary boost to the resurgence in profitability, has faded. Furthermore, the early surge in consumer confidence has yet to transform into stronger economic activity. As noted over the weekend Morgan Stanley’s Chief Economist Ellen Zentner wrote:
‘ARIA appears to have fallen off a cliff in April, with a 0.72% decline, the largest since December 2008.’
(Note: ARIA, is a monthly US macro indicator based on data collected through primary research on key US sectors such as consumer, autos, housing, employment, and business investment.)
This has shown up in a bit of a “cluster ****” as money is quickly jumping from once sector to the next trying to figure out what the next “trade” is going to be.”
“In the lead right now are sectors that are both “risk on” (ie Technology, Emerging Market and Discretionary) as well as the “risk off” sectors. (Utilities, Health Care and Staples).
Talk about confused.
The problem, of course, that both trades are unlikely to be right. Either the market is going to breakout to the upside with a clear participation in the ‘risk on’ stocks, or money will begin a rotation into the ‘risk off’ trade of bonds and defensive equities. “
Of course, on Wednesday, it was the “break to the downside” which occurred sending bond prices soaring.
Sector Review
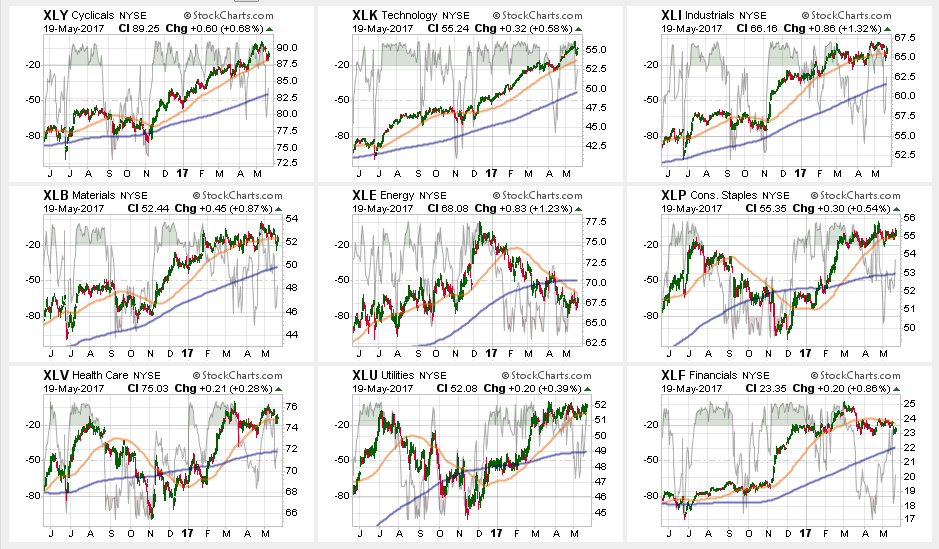
As suggested on Tuesday, a downside break would send flows into defensive sectors. Staples and Utilities were the clear winners last week.
Discretionary, Technology, Health Care, and Industrials all took a hit last week but ended the week above their respective 50-dma’s.
Materials and Financials broke below their 50-dma’s. It will be important for these sectors to maintain their support levels.
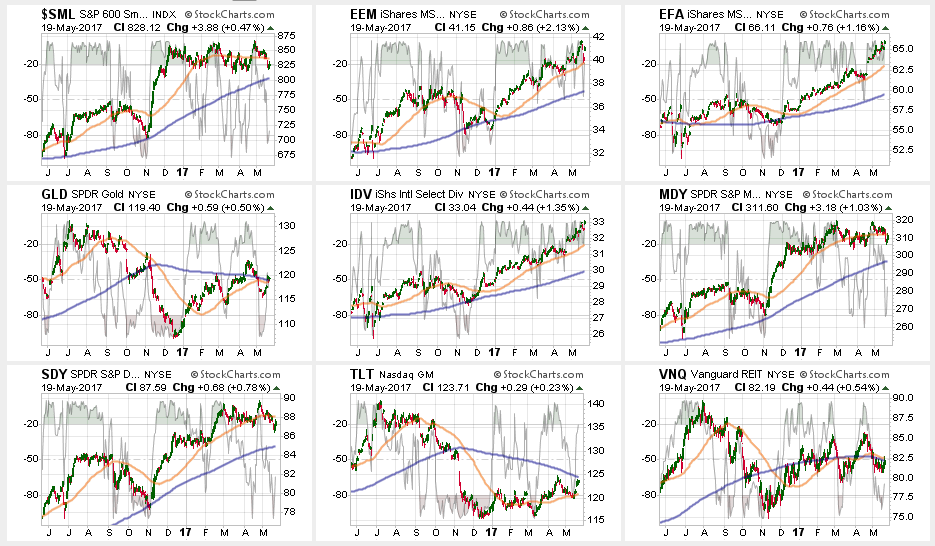
Energy has triggered a major sector sell signal with the cross of the 50-dma below the 200-dma. Remain heavily underweight energy for the time being. The recent rally in oil prices has failed to provide much support for the sector last week which continues its downtrend for now.
Small and Mid-Cap stocks both broke their respective 50-dma’s which puts these areas in portfolios at risk for now. The failure to maintain previous strength from the post-election “Trump Trade” puts support levels into close focus. Stops should be maintained at March lows.
Emerging Markets and International Stocks continued their strength since their election lows as money continues to chase performance. There is a good bit of risk built into international stocks currently. We took profits a few weeks ago, but the recent extension suggests another round of rebalancing is likely wise. Take profits and rebalance sector weights but continue to hold these sectors but stop levels should be moved up to the 50-dma.
Gold remains out of favor. The short-term trading opportunity failed and long-term traders never got above $1300/oz to enter. See note on Gold above.
S&P Dividend Stocks are flirting with key support levels currently after breaking below their 50-dma. With the sector oversold, hold current positions but maintain stops at the lows from last week.
Bonds and REIT’s had gotten oversold last week and found some support this week with the surge in the “risk off” trade as discussed above. Both sectors are trending positively but are struggling with major overhead resistance. A breakout of these two sectors will likely coincide with weakness in the broader market, so watch these sectors for clues as to what happens next.
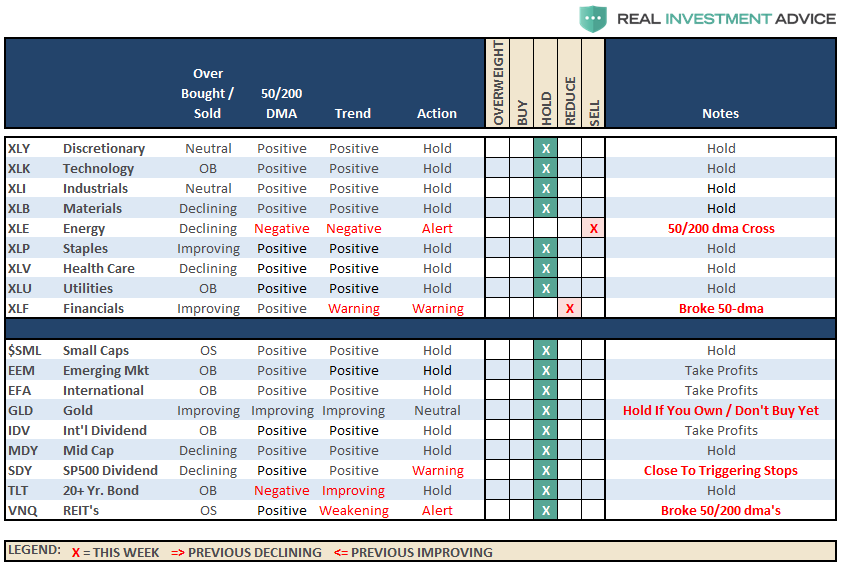
The table below shows thoughts on specific actions related to the current market environment.
(These are not recommendations or solicitations to take any action. This is for informational purposes only related to market extremes and contrarian positioning within portfolios. Use at your own risk and peril.)
Portfolio Update:
The bullish trend remains positive, which keeps us allocated on the long side of the market for now, but the weekly “sell signal” alert is not being dismissed.
We are currently evaluating short-term market action to see if there is an opportunity to allocate some of our retained cash into underweight equity positions currently as part of the rebalancing process. I would like to see some continued strength into next week for confirmation before adding additional risk. This is particularly the case as we move into the seasonally weaker months of the year. We are maintaining stops at recent support levels on all sectors and at 2325 on the S&P 500.
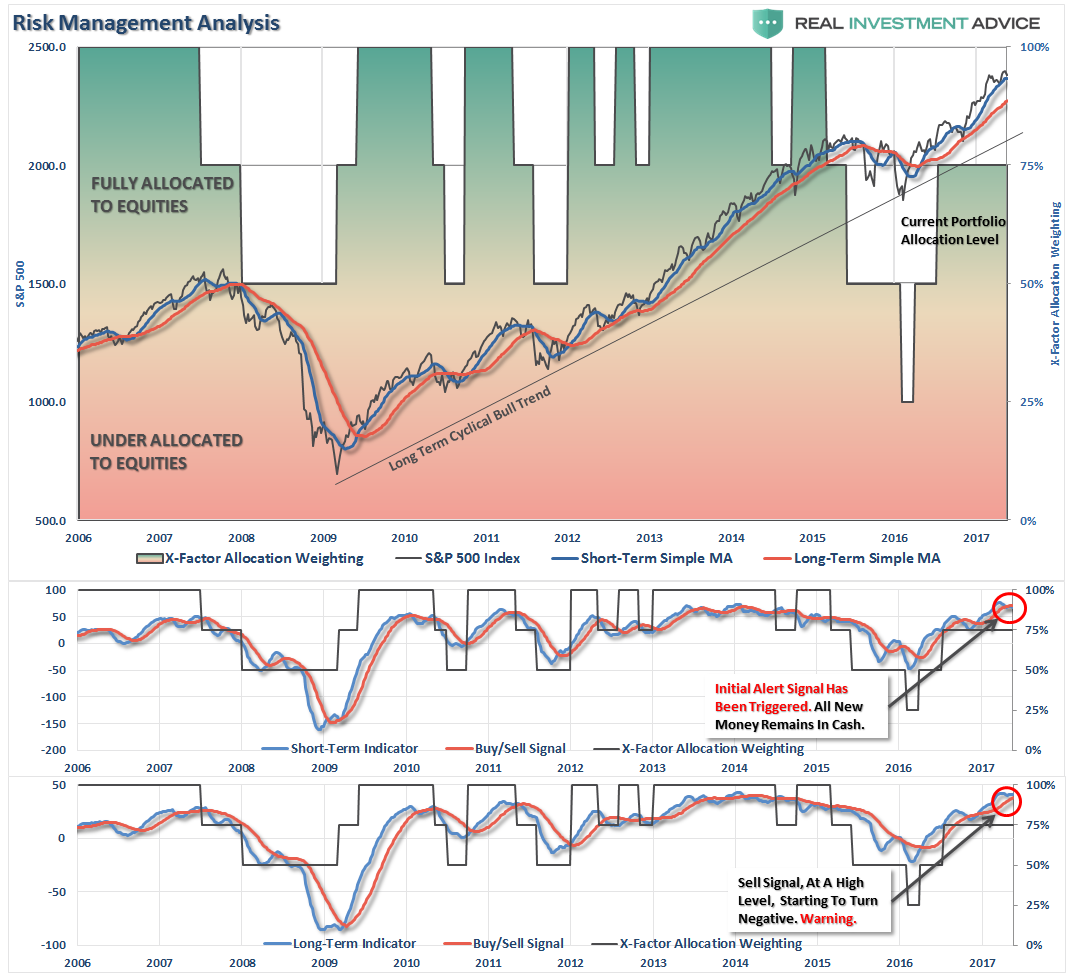
THE REAL 401k PLAN MANAGER
The Real 401k Plan Manager – A Conservative Strategy For Long-Term Investors
There are 4-steps to allocation changes based on 25% reduction increments. As noted in the chart above a 100% allocation level is equal to 60% stocks. I never advocate being 100% out of the market as it is far too difficult to reverse course when the market changes from a negative to a positive trend. Emotions keep us from taking the correct action.
Markets Take A Hit
Last week, I raised the issue of a “breakout” reversing the weakness in the market from March. However, as was my concern, the “breakout” was very short-lived and the markets took a hit on Wednesday following concerns of an “obstruction of justice” potentially stalling legislative active indefinitely. Fortunately, it turned out to be just another #FakeNews story from the very people who state they are not #FakeNews.
However, the recovery on Thursday and Friday was not enough to reverse the short-term “sell signal alert” as of yet which keeps the allocation model on hold this week.
For now, maintain cash levels, rebalance portfolio allocations and let’s see what happens next week.
We continue to watch developments closely and feel we have enough equity risk at the moment giving the current backdrop. If things improve next week, we will upgrade the allocation model with an expectation of a 90-day holding period outlook. (This is due to stay in alignment with 401k trading restrictions. If we cannot get comfortable with a 90-day outlook, we will remain on hold.)
Refrain from adding further fixed income holdings, for now, take some profits from overweight holdings, but maintain exposures.
If you need help after reading the alert; don’t hesitate to contact me.
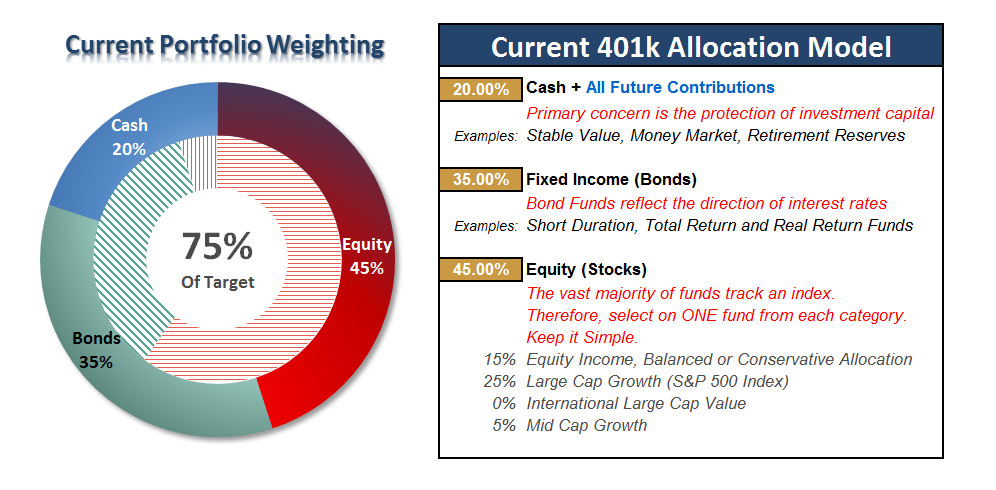
Current 401-k Allocation Model
The 401k plan allocation plan below follows the K.I.S.S. principal. By keeping the allocation extremely simplified it allows for better control of the allocation and a closer tracking to the benchmark objective over time. (If you want to make it more complicated you can, however, statistics show that simply adding more funds does not increase performance to any great degree.)
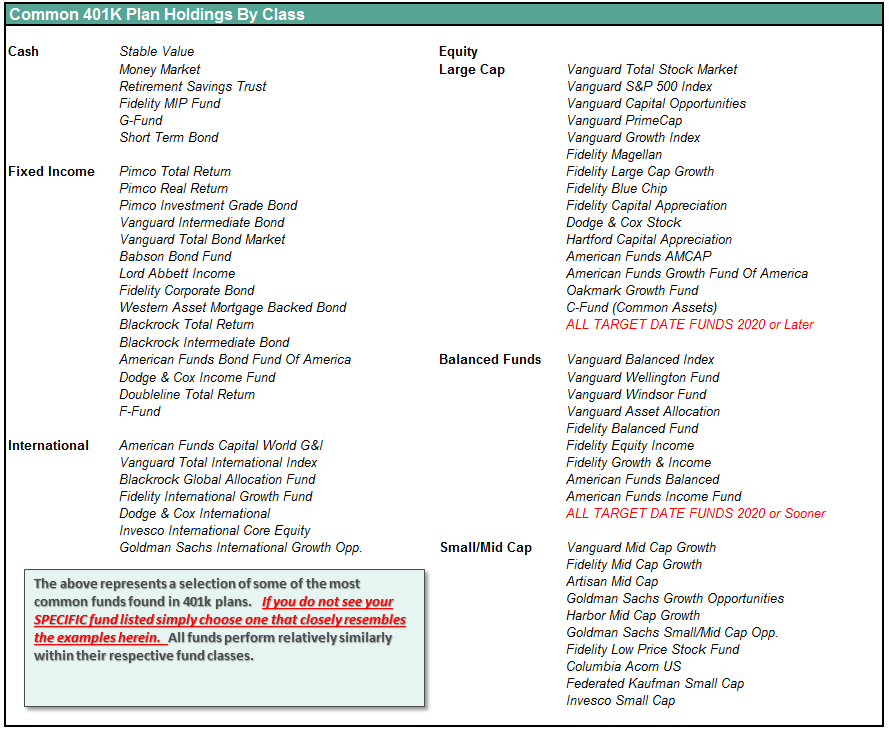
401k Choice Matching List
The list below shows sample 401k plan funds for each major category. In reality, the majority of funds all track their indices fairly closely. Therefore, if you don’t see your exact fund listed, look for a fund that is similar in nature.

